Highlighting pest and disease monitoring methods for apple and pear orchards
Monitoring populations of pests, diseases, weeds and beneficial organisms, such as predators and parasitoid wasps, is an important component of implementing integrated pest, disease and weed management in orchards.
Pest and disease monitoring in your orchard does not need to be onerous or time-consuming. Deciding where to sample in your orchard is the first step.
Modern plantings commonly use trellised trees that are closely planted within the rows. However, there are many productive orchards that were established with free-standing trees at wider spacings. In this article the term ‘tree’ is interchangeable with ‘panel of trellis trees’.
Most orchards have discrete blocks that are capable of being treated as management units. It is recommended that each block is sampled independently to allow for differences in microclimate, varieties, age and history from previous seasons. How many blocks you sample is your decision, but the results from each block should be recorded on separate IPDM Monitoring Sheets.
Within a block it is preferable to select trees at random each time you conduct monitoring. Random sampling gives each tree an equal chance of being selected and ensures that a representative sample of the entire block is taken. Five sample trees selected randomly each time is sufficient if you monitor each week. It is important to remember that these trees are samples and as you walk from one sample tree to another, you should develop sufficient situational awareness to notice if your sampling results reflect your overall impression of tree health in the block.
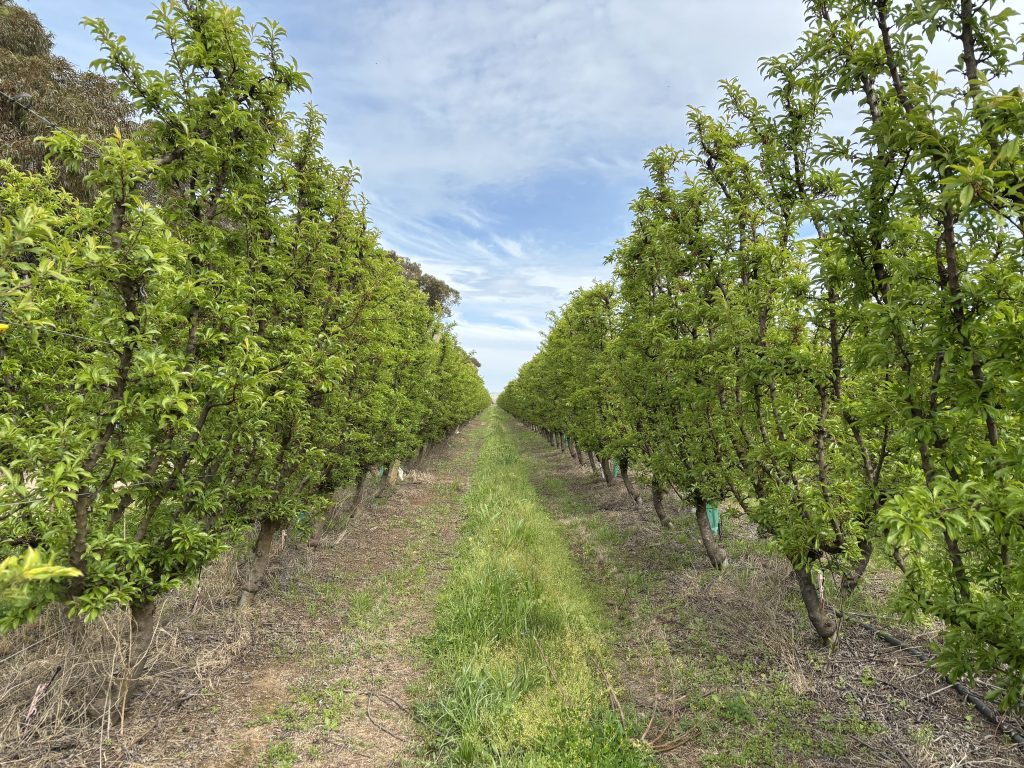
Sampling each block independently allows for differences in microclimate, varieties, age and history from previous seasons. Photo: Ruby Rhodes
Suggested monitoring methods
There are four general categories of sampling based on the use of five trees selected at random each date that you conduct monitoring. These have been designed to allow monitoring of multiple pests or diseases with the one sample and are:
- 20 flower clusters (four clusters x five locations on the tree) per tree
- one-minute inspections per tree
- 10 randomly selected leaves per tree
- 100 randomly inspected fruit per tree.
You do not need to use all four categories each time you monitor. For example, flower clusters are only inspected from pink bud to petal fall and the 100 fruit inspections are only conducted in mid-January, late February or early March, and in the week before harvest.
Twenty flower clusters per tree
To monitor apple dimpling bug (ADB) and thrips, place a white 1–4 litre plastic ice cream container underneath a shoot, with at least four flower clusters immediately above the container. Tap the clusters from above with your hand three to four times in quick succession. Count and record the number of bugs caught in the container. Do this in five different locations on each of the sample trees. The bugs will be more active in warmer weather and could fly out of the container, so it is preferable to do this sampling in the morning.
Thrips will also be dislodged into the container using this technique, so also look for and count thrips. If thrips are present and western flower thrips are known to be present in your district you can collect some of the thrips into a specimen jar, so you can have them identified later. Flower tapping is only conducted between pink in apples, or finger bud in pears, and petal fall. However, if western flower thrips are identified in your samples you should continue to monitor throughout the growing season by using blue sticky traps to indicate if the thrips build up as the fruit matures. Feeding and egg-laying at this stage will cause russet.
One-minute inspection per tree
As you spend one minute walking around a tree, or along a panel of trellised trees, count and record the number of budworm (Heliothis), looper, pear slug, light brown apple moth (LBAM) larvae, weevils and mealybugs you see. During the same inspection look for:
- presence of diseases such as scab, powdery mildew, Alternaria on leaves and fruit, and bitter rot on fruit
- presence of lacewings, hoverflies and ladybirds.
You can use the same sample to score the severity of woolly apple aphid (WAA) infestations using the following scoring system:
0 = nil WAA colonies observed
1 = trace infestation (<5 small colonies)
2 = light infestation (>5, <10 per cent of tree)
3 = moderate infestation (>10, <25 per cent of tree with large colonies)
4 = severe infestation (>25 per cent of tree with large colonies)
The same scoring system can be used to indicate the level of parasitised woolly apple aphid colonies.
Ten leaves per tree
This technique is used to determine the percentage of leaves infested by mites and their predators, as well as leafhoppers/canary fly and mealybug crawlers. If two-spotted mites (TSM) are the main pest mite in the orchard, then 10 leaves can be randomly selected from about 1.5–1.8m above ground from the inner canopy. If European red mite (ERM) or Bryobia mite are the dominant species, then sampling should start at first bloom on pears or pink on apples, and leaves should initially be sampled from the outer parts of the canopy. If TSM and ERM/Bryobia mite are present, then the 10-leaf sample should include leaves from both the inner and outer canopy.
There is no need to count the number of mites or eggs per leaf. A simple presence/absence for each leaf is sufficient. The number of leaves with mites present can be converted to percentage of leaves infested which, in turn, can be used to calculate the cumulative leaf-infested days throughout the season. The most important consideration is not the number of mites per leaf, because the level of damage depends more on the percentage of infested leaves and how long they have been infested. Presence/absence of predators can be scored using the same system and the same leaves used to score mites.

For this visual monitoring method, randomly select 10 leaves from the inner canopy and note the presence or absence of mites or eggs on each leaf. Photos: Greg Lefoe
One hundred randomly inspected fruits on trees
Randomly select 100 fruits, starting near the top of the canopy and working downwards. For free-standing trees, inspect 25 fruits from each of four sides of the tree. For trellised trees, inspect 25 fruits from each of four trees within a panel. The fruit do not need to be picked but should be carefully inspected without excessive lifting or twisting that would dislodge them. Simply record the presence or absence of the target damage for each fruit and then calculate the percentage of damage attributed to each pest or disease.
Fruit damage assessments should be conducted in mid-January (after natural fruit drop), one week before harvest of early varieties harvested in February, or in late February/early March for later varieties and, for late varieties, again about a week before harvest.
Codling moth-damaged fruit detected in these samples could be removed from the tree and carefully cut open to collect the larvae if they are still present. The age of the larva can be determined by measuring the width of the head capsule and noting the colour (black or brown) of the head capsule to identify the larval instar. Once the instar is determined, reference to a development chart will indicate how many degree-days ago the larva hatched from the egg (refer to Table 1).
Table 1: Identifying different codling moth instars (stages of larval growth).
| Instar | Approx. head width (mm) | Head capsule colour | DD from egg hatch |
| I | 0.3 | Black | 0–88 |
| II | 0.5 | Brown | 84–151 |
| III | 0.8 | Brown | 125–216 |
| IV | 1.25 | Black | 205–363 |
| V | 1.6 | Brown | 248–452 |
Implementing standardised record-keeping
This article provides monitoring guidelines (other than trapping) to be read in conjunction with the IPDM Monitoring Calendar and the IPDM Monitoring Sheets that can be accessed here:
Growers and advisors can use these guidelines to assist them to implement standardised record-keeping, improving interpretation and comparison of what’s happening across an orchard or within regions. Not all pests or diseases mentioned will be present in your orchard, region, or state. They have been included to allow national applicability of the information. While there are alternative methods for monitoring, such as trapping, those outlined here are easy to implement when monitoring both pest and beneficial populations.
Resources
The Integrated Pest and Disease Manual for Australian Apples and Pears (IPDM Manual) (2nd edition) was prepared by David Williams and Oscar Villalta (Agriculture Victoria) with contributions by Stephen Quarrell (University of Tasmania), Kevin Dodds (NSW DPI), Paul James (Lenswood Co-op), Alison Mathews and Stewart Learmonth (WA DPIRD).
Download a copy of the IPDM Manual – extensionaus.com.au/ozapplepearipdm/ipdm-manual-for-apples-and-pears
Acknowledgment
 The PIPS 4 Profit Pest and Disease Management (AP22001) project has been funded by Hort Innovation, using the apple and pear research and development levy, contributions from the Australian Government and co-investment from Agriculture Victoria. It is supported regionally by the Tasmanian Institute of Agriculture, Pomewest and NSW Department of Primary Industries and Regional Development. Hort Innovation is the grower-owned, not-for-profit research and development corporation for Australian horticulture.
This article was first published in the Summer 2024 edition of AFG.