Counting down to harvest – crop load metrics throughout the season
Gathering crop load metrics from the pruning stage right through to harvest, and using those numbers and data to manage the crop load is key to achieving fruit targets.
A bin filled with apples matching your size and quality targets is the realisation of successful season-long crop load management. The volume and quality of fruit comes from decisions made using real metrics gathered from winter through to summer. To be over the target at harvest requires collecting data before pruning and continues through harvest. This numbers-based approach reduces the potential fruit numbers down to the yield target and gets the right fruit into the bin.
Knowing the status of the trees at the beginning of the season makes crop load management decisions easier. You can’t manage what you don’t measure – pruning strategies, thinning decisions and follow-up interventions require accurate records of historical block performance, current crop load status and market targets to get them right the first time.
Crop load management theory
Yield, size, colour and finish – these four interlinked factors drive returns for both premium and commodity varieties. Yield equals more returns and lower costs per unit, for example per hectare, per gross kg or packed kg. Size is a component of both yield and quality. The other factors that comprise the quality of the fruit, colour and finish determine the returns per unit. Yield and fruit size are the main focus for crop load management, and this starts with setting pruning targets at the beginning of the season. Fruit quality is largely due to correct crop yield and size results. Therefore, it is imperative to know your target sizes and yield before precision pruning.
A profitable block – one that is categorised as green on the ‘Improve or Remove’ block matrix (Figure 1) – delivers consistent yields of a profitable variety. To achieve consistency of yield, crop load needs to be adjusted early each season. Fruit left late on the tree and only tidied up after a second round of hand thinning will have already sent the signal to the tree to reduce floral bud development for the next season. If enough excess fruit is left late, trees within the block will become biennial bearing, playing havoc on consistent yield goals. It is also a drag on overall fruit sizing.
An advantage of starting the counting process earlier is that you are ahead of decisions regarding the need to hold doubles on clusters or not, and the resultant effects on fruit size and colour.
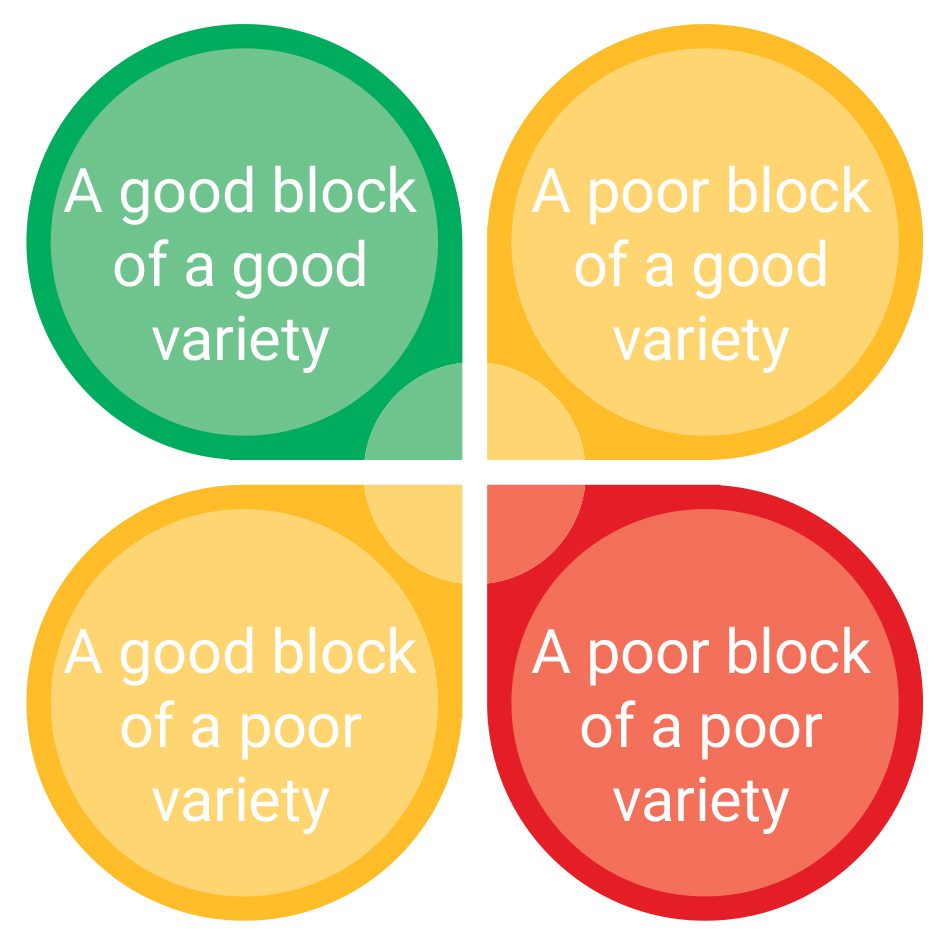
Figure 1: The ‘Improve or Remove’ matrix was introduced by AgFirst at the 2024 Future Orchards® walks and can assist with decision-making.
Counting techniques
Modern apple blocks typically have between 1,900 and 3,333 trees per hectare. For a counting program to achieve a level of representation and accuracy, clear and deliberate methods are needed.
Manual counts
Manual counting is a tried-and-true method for quantifying crop status in the block. Having the right people counting is key, plus a good quality control (QC) process – I’ve seen counts be off by 100 apples on one tree before! To avoid this and other sampling errors, clear methodology is needed but just as important is to have a culture of accountability in the team. Logging the counter’s name along with the fruit or bud number and date, in addition to any QC checks on the same tree, is part of this process. Simple data collection apps can make this easier. Manual counting should be considered the default method for collecting crop load data, but limitations of required labour and skillset, and the time taken to count mean it’s commonly not done enough.
Scanning
An alternative, less time-consuming, commercially available option for counting is camera scanning technologies. These powerful tools can be used to gather large volumes of information at key phenology stages. The volume of data and the comparatively quick collection time allows numerical data to be gathered before key phenology stages, and the information is then used to drive management decisions.
Commercially available scanners can collect the following information:
- Bud counts pre and post pruning.
- Flower cluster counts and percentage of bloom.
- Fruitlet counts pre and post secondary chemical thinning.
- Fruit counts pre and post hand thinning.
- Fruit sizing and growth curve targets.
Not all scanning technologies are currently able to gather all the data listed above; however, most are trying to, which makes scanning an interesting technology space for the modern fruit grower.
In Figure 2, which was taken before harvest, it’s too late to adjust the crop, but management decisions can still be informed by the data. For example, the eastern 10 rows with low fruit numbers may need to be picked separately if the variety is susceptible to disorders exacerbated by low cropping numbers per tree. Also, extra polliniser trees could be planted on the western side as these rows are closer to a kiwifruit block. An irrigation test of the block will show if the yield patterns revealed by the scan are caused by uneven flow rates.

Figure 2: Yield variation from ground-based camera scanning overlaid onto a satellite map, which can be used to inform management decisions.
Floral bud analysis
An underutilised counting technique is floral bud analysis. The challenge is that categorising buds is most obvious closer to spring when the bud morphology starts responding to environmental cues; however, key blocks can be earmarked for later winter pruning with floral bud analysis beforehand. There are a few main scenarios for floral bud analysis for a block:
- The block is in a potential biennial bearing situation, given the previous season’s crop load.
- There were climatic conditions for potentially poor bud formation; this could include stress in the previous season during flower induction, low chill hours during winter, or potential cold damage from extreme freeze events.
- As part of a deliberate strategy to use pruning as the main crop load management technique, some growers prune to a low fruit to bud ratio, for example 1:1.25. However to undertake this approach, information regarding the floral bud percentage is critical.
- The crop is a premium variety farmed with a high input, higher outputs strategy.

Figure 3: Floral buds dissected and analysed for floral status. The bud on the left is floral and the one on the right is vegetative.
Crop load management in action
With a mature canopy, a three-year rolling average will inform you of the block’s yield capacity. There can be room for an immediate lift if yields have been intentionally or inadvertently lower than optimum; however, more likely, it will involve strategies improving canopy percentage fill and raising the quantity and quality of fruiting wood to bear slower gains.
Setting targets
Your plan starts with a block analysis involving the following:
- 3-year yield average – demonstrates block performance.
- Last season’s size profile – benchmark against market requirements.
- Biennial bearing risk – floral bud analysis.
- Insights from packing line defect analysis – what needs to change?
Calculating targets
There are a number of ways to calculate targets, including working backwards to calculate fruit per tree targets, and measuring trunk or branch thickness.
Working backwards to calculate fruit per tree targets for an orchard with 2,604 trees/ha, for example, would look like this:
- 68 T/ha 3-year average, 75 T/ha target with earlier completion of hand thinning to achieve size and yield lift.
- 225 gram fruit weight target.
- 128 fruit per tree picked.
- Ideally floral bud analysis would provide a calculation factor, for example, average of 128/tree ÷ 0.85 = 150 fruit buds.
- A lean strategy of 1:1.25 fruit:bud ratio results in 188 likely to be fruiting buds left per tree.
- Insurance policy is hanging some doubles on strong wood rather than leaving more buds.
Another method to calculate targets is to use a measurement tool for trunk cross-sectional area (TCA) or branch cross-sectional area (BCA). This measurement is then averaged across the block to give TCA for each tree, or with BCA it’s added up and then divided by the number of branches.
Ultimately, the total capacity of the fruiting wood is estimated and a number of apples per cm2 is assigned. In Figure 4 this branch has a 1.5cm2 BCA. If the variety has seven apples per cm2 then this branch can hold 10.5 apples. 10.5 is then multiplied by number of branches, with a correction factor if the top of the canopy varies from the bottom.
The TCA method is primarily used in younger blocks. It fades in usefulness from years 6 to 8 onwards as TCA continues to lift; however, canopy volume becomes restricted once the canopy has filled its space. BCA can work well on branches that are not highly manipulated, which applies to most of the modern spindle or 2D canopies. BCA can provide unrealistically high numbers in formal canopies where permanent branches tied to the wire continue to thicken and you farm the spurs. However, it is a good tool where the branches are not heavily manipulated by pruning. Once a block is mature, targets can be benchmarked against variety yield standards for the canopy type.
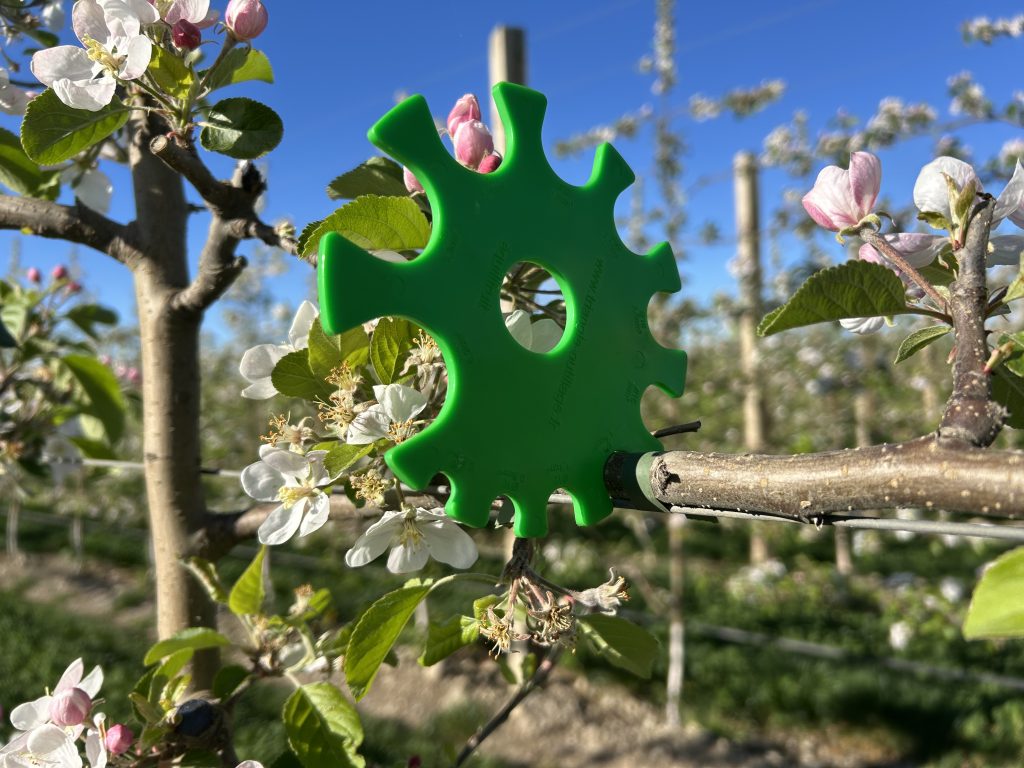
Figure 4: A commercial TCA/BCA disc, known as a MAFCOT wheel.
Pruning to rules and numbers
This crop load management strategy is defined by benchmarking the effect of pruning based on simple rules against the calculated bud target. Supervisors know the bud number and check during pruning, but individual pruners are only focused on the rules. The first step is a test run of representative trees or a bay pruned to a set of familiar rules like the following:
- Renew branches in the top half of the tree greater than 50 per cent diameter of the trunk.
- Remove shoots on the top and bottom of each branch.
- Cut side shoots to a maximum of the secateur length.
- Single branch ends.
- Space remaining spurs a fist width apart.
Fruiting buds left after pruning are counted and matched to the calculated target. For example, 188 buds are required in order to pick 128 apples at harvest. After test pruning, if the fruit/tree average is slightly above, for example 216 fruit (15 per cent above), you would likely continue with the rules unchanged as this is a straightforward plan in its execution. The excess 15 per cent buds still must survive bloom, pollination and chemical thinning before they are excess load for hand thinning. This is a fair trade off for an executable pruning plan. If counts are lower than target then the rules need to be adjusted, for example by limiting branch removal, or leaving 12 o’clock spurs.
Case study: crop loading by numbers
This strategy is all about numbers. A formal training system allows for formal crop load management. In the example in Table 1 for a 2D block, the management unit is described as an ‘L’, which is the wire from trunk to trunk plus the fruit on the trunk. An eight-wire trellis has eight Ls per tree. The effect is that the block is divided up into discrete units. Table 1 calculates Ls per hectare and fruit needed per L to achieve yield targets based on size and tonnage.
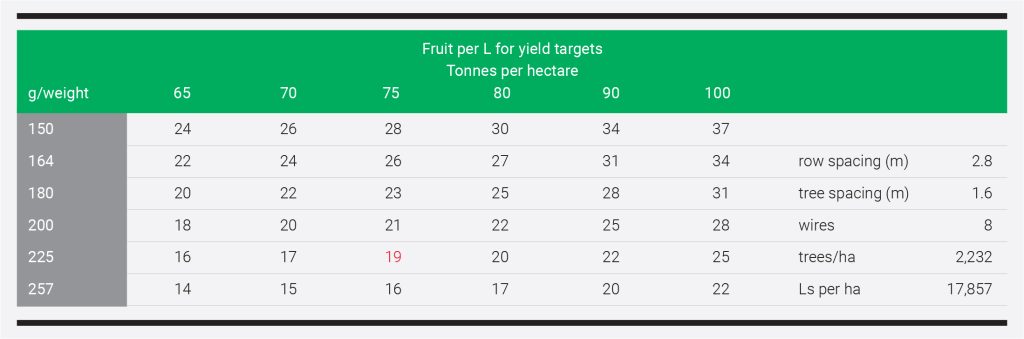
Table 1: To achieve yield targets based on size and tonnage, calculate the Ls per hectare and fruit needed per L.
Source: Craig Hornblow, AgFirst
Using the same targets and assumptions from the first example, this is 19 apples picked per L. At pruning, with floral percentage and fruit:bud ratio factored in, 28 fruiting buds are left per L. Buds still need to be spaced out along the wire. This is precision pruning – breaking hectares down into manageable units. There are a lot fewer excess fruit compared to the first method, but because they have been removed earlier there is less reliance on chemical thinning and hand thinning for adjusting crop load. This front loading the removal of fruit to a more ideal number provides a lift in quality with more consistent size and distribution and a reduction in expenses during hand thinning. There is a consistency of target and execution with this method. During hand thinning, fruit is removed down to the final target of 19 per L.
More metrics to harvest
There are continuing opportunities to put real numbers against management decisions and results throughout the growing season. Good data feeds good decision-making and quantifying the results allows the feedback loop to close. Armed with real information from your block, you can proactively get the crop to be closer to the target.
Irrigation
Soil moisture levels impact on a wide range of harvest parameters, including fruit size and colour, and fruit calcium status. Accurate irrigation records benchmarked against soil moisture levels from probe data, or plant stress sensors, combined with local environmental data allows a postharvest retrospective analysis if there are any issues where irrigation could be a factor. Even better is having the data to drive decisions during the season in the pursuit of fruit quality and mitigating outside events like low dams.
Nutrition
Soil and plant nutrient status is a multi-season conversation. At AgFirst, as standard, we measure three times a season: postharvest soil sampling, spring leaf testing and summer leaf testing to track nutrient status with crop development. A database of records allows the tracking of trends over a series of consecutive seasons.
Fruit maturity
Pulling apple samples – starting weeks earlier, ahead of the anticipated harvest time – can track development of key quality characteristics including pressure, starch conversion, dry matter, titratable acidity, and foreground and background colour. It will capture if any maturity indices are racing ahead and data can be benchmarked against previous seasons. This can be continued after harvest as a fruit storage library to monitor which blocks have the best storage potential.
Bins per block
When there are multiple blocks of the same variety all being harvested, it can be tricky to get accurate bin counts per block. It is worth the effort to keep accurate tabs on individual block yields – this information is key to the final analysis of how your crop load management has shifted the needle.
Conclusion
Crop load management is a season-long endeavour. There are multiple opportunities to gather crop load metrics starting at pruning and going all the way through to harvest. A common refrain is wishing you had counts from before the previous crop load management action. It takes deliberate effort to gather this data. There are new opportunities to use scanning techniques which will increase the volume and quality of information regarding crop load status; however, manual counting is still the standard practice and will remain important as a backstop and verification tool for scanning technology.
Fostering an orchard-wide ethos of counting and gathering data has multiple benefits. The main reason is that the data informs better decisions, from choosing thinning spray rates to planning how many hand thinners to hire. A secondary consideration is that within a team culture, assigning numbers (and names) against actions results in more accountability and responsibility within the team. This leads to better job clarity and better follow-through.
Further information
Find out more about the Improve or Remove matrix here: apal.org.au/wp-content/uploads/2019/08/2024-Nov-FO-AgFirst.pdf
This article was first published in the summer 2025 edition of AFG.