Cartographer maps path to uniform, high quality pears
New crop mapping technology has insights for managing crop load variability and improving packouts.
Crop load and yield variability in pear orchards represents one of the biggest challenges for growers.
A significant part of the challenge is the difficulty of manually assessing variability across blocks and time and measuring the effectiveness of management approaches.
Pioneering research at Agriculture Victoria’s Tatura SmartFarm and on commercial orchards is demonstrating the potential that new flower and fruit mapping technology has to improve understanding and better management of variability. The current work being undertaken is part of the PIPS3 Program’s Developing smarter and sustainable pear orchards to maximise fruit quality, yield and labour efficiency (AP19005) project being led by Agriculture Victoria.
Crop yield variability
Variable yield is seen both between and within blocks (spatial) and between seasons (temporal). Many factors influence crop load variability including inherent biennial bearing, weather and pollination. In orchards, both spatial and temporal variability need to be minimised to simplify management and achieve regular cropping.
At an ANP-0131 (marketed as Ricó) blush pear field walk at his Calimna Orchard in November, Ardmona senior fruit grower and industry leader Matthew Lenne made clear the practical value of a greater understanding of spatial variability: “Understanding spatial patterns of flowering and fruiting will enable growers to prioritise and plan thinning management,” he said.
Technology that helps quantify spatial variability in flower and fruit numbers and maps it for ease of viewing, can deliver that understanding and be used to consistently optimise crop load season after season. Spatial estimates of flower and fruit numbers are fundamental to optimising management strategies such as thinning and data has the potential to be interfaced with variable rate chemical thinning sprayers for high-precision, automated management.
Predicting flower and fruit number
The application of flower and fruit recognition techniques based on artificial intelligence provides the opportunity to estimate several crop parameters in orchards. However, only a few companies have commercial ground-based or aerial platforms capable of accurately predicting crop parameters. The Australian based company Green Atlas targeted this market gap and recently developed Cartographer, a ground-based mobile platform that has been successfully used to rapidly scan commercial orchards and produce flower and fruit counts in apples.

Green Atlas Cartographer in the ‘ANP-0131’ planting systems experiment at the Tatura SmartFarm.
Scanning with Cartographer can very quickly produce a ‘relative heatmap’ of flower and fruit number per tree that clearly shows the variability across an orchard block. For more accurate determination of the absolute numbers of flowers or fruit, Cartographer requires calibration for a specific block. Calibration requires ground-truth counts of flower clusters and fruit in calibration zones. In most cases, spatial and temporal variability within orchard blocks can be determined by simply assessing uncalibrated spatial maps.
Flower and fruit variability in ‘ANP-0131’ pears
The blush pear cultivar ‘ANP-0131’ produces fruit with superior texture, flavour and appearance, but is known to show a biennial bearing pattern. “Utilising tools like Cartographer can help growers mitigate biennial bearing and assess the success of crop regulation practices”, Matthew Lenne explained at the field walk.
The Tatura SmartFarm hosts two experimental trials with ‘ANP-0131’ pears. The Planting systems experiment encompasses a combination of different tree spacings, tree architectures and rootstocks and is an ideal setup to visualise the spatial variability of flower and fruit number predicted by Cartographer.
Orchard scans were conducted at:
- full bloom during 2020-21 (16 September 2020),
- six weeks prior to harvest in 2020-21 (8 January 2021), and
- at full bloom in 2021-22 (18 September 2021).
The aim was to assess spatial and temporal variability of flower clusters, fruit number and return bloom by simply comparing orchard maps. Heatmaps show that some experimental plots had higher numbers of flower clusters on 16 September 2020, with trees grafted on Quince A with Beurre Hardy interstem generally producing more flowers than trees on D6 and BP-1. The spatial variability of fruit number (8 January 2021) was slightly reduced in comparison, although trees on Quince A maintained a higher crop load.
In the current season (2021-22), return bloom was 1.5-fold higher than in 2020-21.
Examining temporal and spatial patterns can help identify orchard blocks or zones within blocks that are stable, exhibit biennial behaviour or are in decline. Furthermore, having both flowering and fruiting maps provides an indication of whether low crop loads have occurred because of poor flowering or poor set. In addition to flower numbers, environmental and management factors such as weather, pollination, irrigation and nutrition can strongly affect the actual crop load at harvest. Hence, fruit number maps are useful tools to solve high spatial variability and to help standardise crop to achieve the best fruit quality standards and regular bearing.

Spatial maps of detections of flower clusters and fruit in 2020-21, and flower clusters in 2021-22 in ‘ANP-0131’ pears. Maps were generated from scans in the planting systems experiment at the Tatura SmartFarm using Green Atlas software.
In pear orchards, not only is it important to determine average flower cluster and fruit numbers and their relationship over time, but also to quantify spatial variability. Green Atlas provides a coefficient of variation (CV, %, i.e., a relative index of spatial variability) that is associated to the block average numbers. For example, heatmaps produced at Calimna Orchard show how flower cluster spatial variability in a block was high (CV = 46 %). Fruit set in the block was relatively low and patchy. Variable fruit set caused an increase of the spatial variability of fruit number (CV = 74 %) compared to flower clusters. Growers should aim to obtain the optimal flower cluster and fruit number while minimising the CV in the block.
Reducing spatial variability will:
- enable orchard automation and mechanisation practices,
- improve manual work management,
- support correct predictions of yield and fruit quality to inform the post-harvest chain and logistics, and
- increase packout.
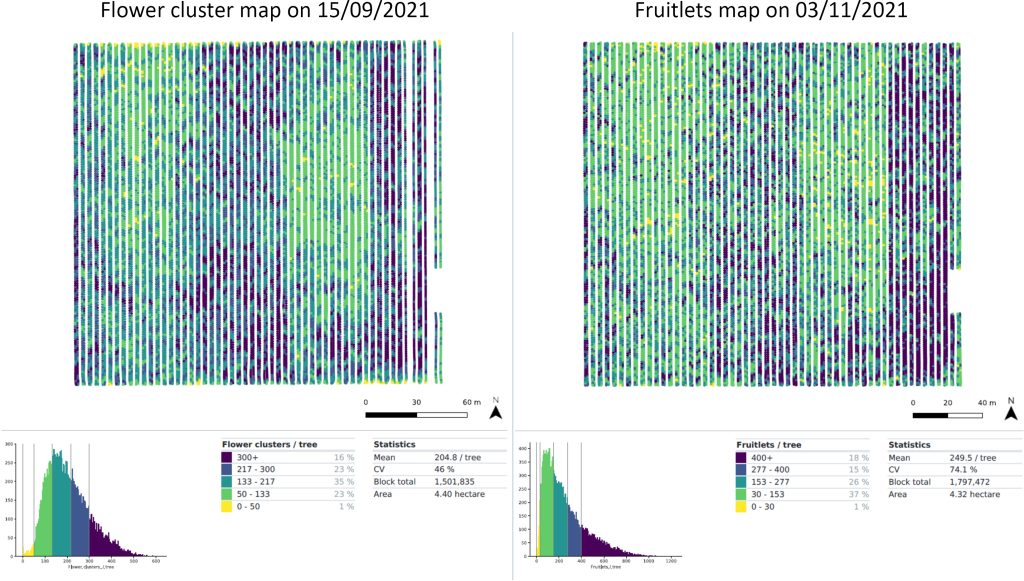
Spatial maps of flower cluster number and fruit number per tree in 2021-22. Maps were generated from scans at a commercial site (Calimna Orchard, Ardmona, Victoria).
Agriculture Victoria is currently conducting research for orchard mapping of flower cluster number, fruit number, tree geometry, fruit size, fruit colour and fruit clustering in apples and pears. Extraction of zonal data is being undertaken to determine relationships between crop parameters that may be used to determine the best cultivar-specific management strategies. For example, Agriculture Victoria is exploring using this data to determine relationships between tree size, the number per tree and fruit size so that growers can target thinning to meet packout requirements.
In summary, the ongoing studies carried out at the Tatura SmartFarm and in commercial orchards are highlighting the potential of using Cartographer in pome fruit to estimate a variety of important relative or absolute crop parameters.
Further information on the utilisation of Cartographer can be obtained from Green Atlas (https://greenatlas.com.au/).
Acknowledgement

The PIPS3 Program’s Developing smarter and sustainable pear orchards to maximise fruit quality, yield and labour efficiency (AP19005) project is funded by Hort Innovation, using the apple and pear research and development levy, contributions from the Australian Government and co-investment from Agriculture Victoria. Hort Innovation is the grower-owned, not-for-profit research and development corporation for Australian horticulture.
This article originally appeared in the Summer 2021 edition of AFG, available online here.