The crop is in, and the results are out
Quality and packout data are a great source of information on how the crop performed and a valuable opportunity to spot areas where attention to detail might reward the effort next season. APAL spoke to a couple of growers and packers to hear how harvest data can be used to boost the bottom line.
Tony Kundert, 9mile Fresh, Victoria
Harvest is an important opportunity to give growers the information they need to improve quality for Agronomist Tony Kundert at 9mile Fresh, at Tynong, in Victoria’s Gippsland region.
Reviewing data on each line of fruit run over the pre-sorter of the facility’s Greefa grader, Tony reports it against around a dozen quality standards and – where that line might be shy of a particular standard – adds feedback on orchard management approaches that could help growers improve performance in the following year.
Growers can see how they measure up on average size, including the percentage that is size 90 or above, as a proxy for the division between being packed into punnets or cartons, weight, breakdown across colour categories, as well as a visual snapshot of defects within the juice bin.
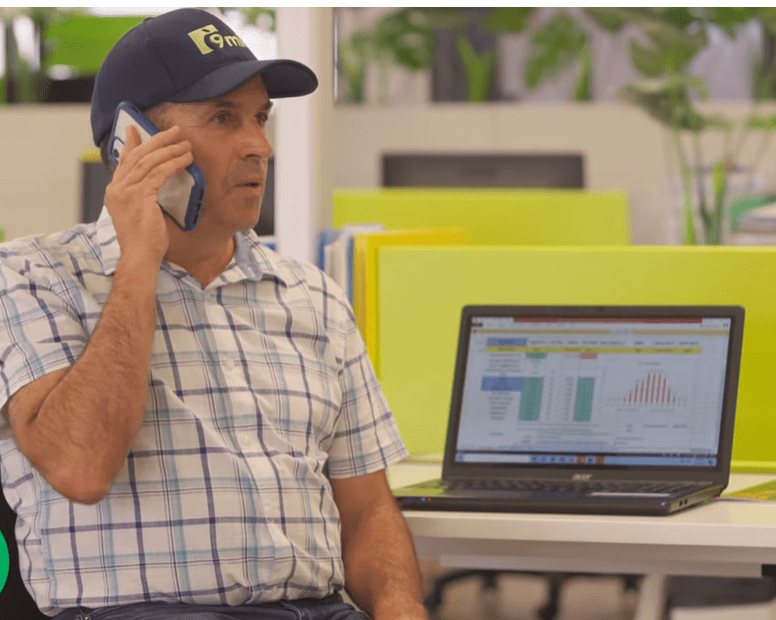
The packout data that Tony Kundert from 9mile Fresh provides to growers is a valuable tool.
Separately, Tony also maturity tests to assess storage potential, measuring and reporting Brix, pressure and starch levels. The report is additional to the packout report generated when the fruit is packed.
“I’ll give them a summary, some of the areas that they can improve on, or if they’ve met the standard, a score, out of 10 or 11 based on those standards.
“They can take it back to the orchard and make adjustments on a host of those factors. They can say: ‘I want to improve this average size from a 140g average to 160g, or 150g’,” he said. “That could be done by more chemical thinning, or hand thinning. Or if they haven’t met the standards on colour and know they can improve packout if there is less low-coloured fruit, either going into seconds or juice; there are a number of ways to do that, whether it’s the reflective mulch or the leaf defoliators.
“It gives positive feedback too. If they’ve met most of the standards, that’s a good thing as they know they can continue along those lines.”
The goldilocks zone for size, Tony said, is a middle size 76 count/160g apple.
“Not too small; it has to be in a carton,” he said. “But you don’t want it to be too large either, because supermarkets restrict the larger sizes too. So, you want to be in that middle size category.”
Tony said access to data on fruit quality put growers in a stronger position to achieve better quality and returns.
“If they have that information, then they can make efforts to improve,” he said. “If they don’t, they’re just running blind. It’s a valuable tool.”
Terry Martella, Santa Rita Orchards, Western Australia
Analysis of their own quality assurance (QA) data and a higher than usual bruising level at packout of last season’s fruit was a valuable red flag that prompted Kirup orchardists Terry, Mark and Basil Martella to isolate the probable cause and change their harvest processes to address it.
The data-savvy team at Santa Rita Orchards quickly identified that worker productivity processes implemented during the season had had an unintended impact on fruit quality.
“We’ve developed systems to pick at speed and get more productivity out of the workers,” Terry said. “But in doing that, we created a bigger problem as far as the bruising goes. Packing has become the biggest cost to us; it’s above labour now. So, all of a sudden, the fastest picking, and the cheapest bin of apples picked, is not necessarily the key metric we want; packout is even more key.
“This year, we changed the focus from speed to quality. The few packouts that we have done this year have been significantly better. So, whether that’s a result of that, the proof will be in the pudding at the end.”
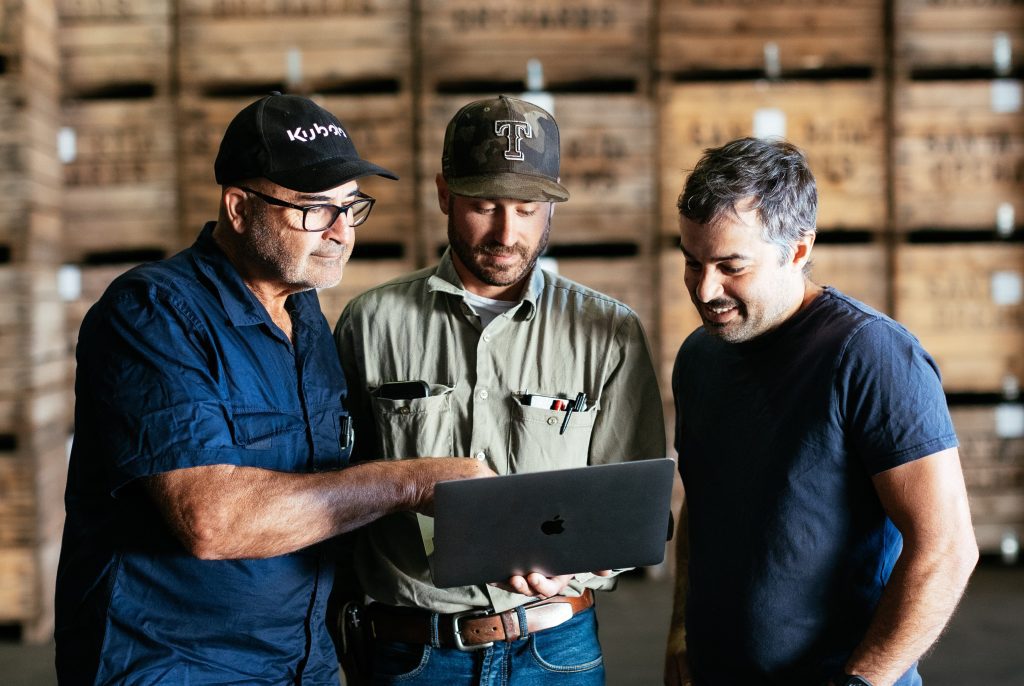
Terry, Mark and Basil Martella use data to drive their decision-making. Photo: Victoria Baker Photography
Santa Rita packs through both the Donnybrook Packing Company and Blue Moon at Kirup, with packing reports received within a few days of delivery. The first thing Terry checks is the percentage Class 1.
“What we really want to see is a figure in the 80s! We know that anything below a 70 (C1 packout) is not going to pay the bills,” he said.
Data drives decision-making at Santa Rita. QA data is collected in the field and then analysed using a bespoke program they developed themselves, which allows them to calculate a dollar return value per bin and to drill down into exactly what is driving return, whether size, defects, costs or price.
Terry said reviewing their own data on how the crop performed was an important step to setting targets for the following year and ensuring the business remained viable.
“Data is the only thing we can base our decisions on,” Terry said. “Experience and what you know only gets you so far; actual data tells the true story.”
Dustin Barolli, Barolli Orchards, Victoria
At Barolli Orchards, in Victoria’s Goulburn Valley, Packhouse Manager Dustin Barolli said, while what was in demand varied from year to year, a good line of fruit would be one that packed out at 80 per cent Class 1 with the majority in the 12kg carton range.
“This year there’s larger fruit, so the demand is on smaller fruit, but last year it was for larger fruit,” he said. “You have to try and find a good balance between, say, a 65 and an 82 (12kg carton count, approx. 145g–185g) and have a nice even spread.
Barolli Orchards uses the PackManager software, designed by GV Custom Software, to provide detailed packout reports of fruit batches run over the Compac grader.
Dustin said reports detailed a percentage by premium, Class 1, Class 2 or juice grade for every size, as well as carton costs, freight costs, storage and tipping charges to provide ‘a pretty efficient cost and bin return straight away’.
“It’s crucial to look at the returns,” he said. “We have to be data focused; it’s easy to think ‘I’m still picking 70 tonne/ha on certain blocks’, but on the numbers, you might be actually losing money, because the fruit is small or sub-par.”
Bruising is the most prevalent defect, and Dustin said if levels were higher than usual, or if there was obvious pest pressure, feedback would be provided to allow growers to have the opportunity to take action to address it.
“It might be that there were a lot of grub stings; they lost 10–20 per cent and they didn’t know they had pest pressure,” he said. “If they know, next season they might spray differently. You need to give that feedback.”
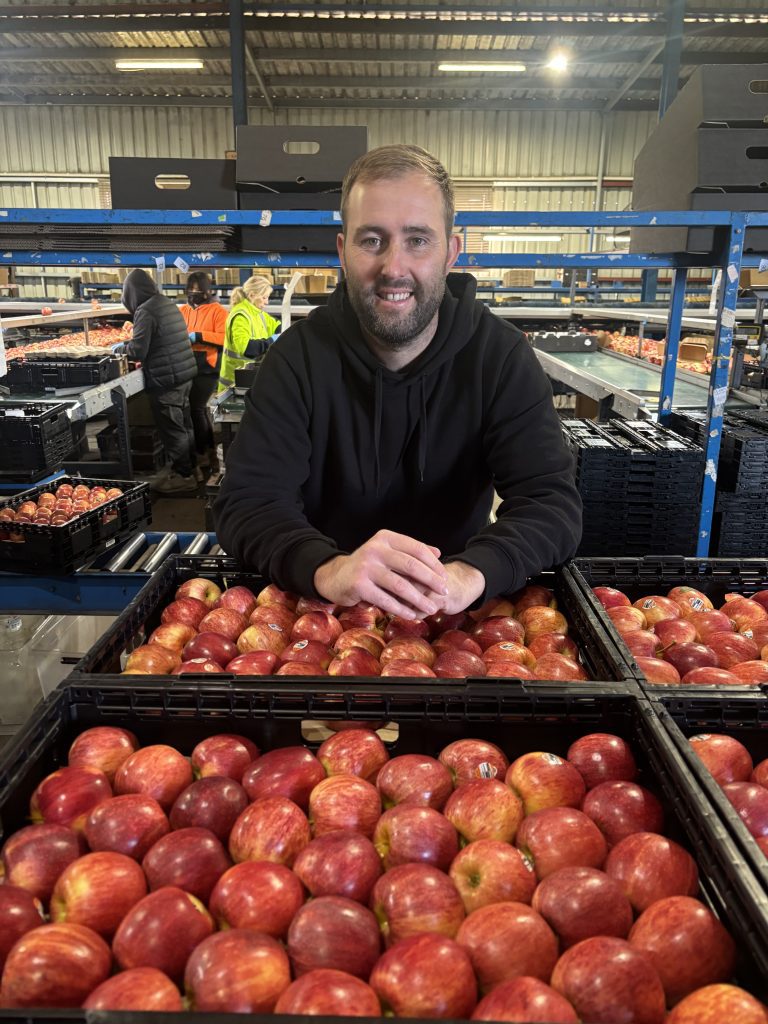
Dustin Barolli provides detailed packout reports to growers, which gives them the opportunity to address any issues ahead of the next season.
Dustin said when their own packout data showed a high level in stem punctures from a crew picking on contract (bin) rates, switching to hourly rates had not only solved the issue, but counter-intuitively increased the bin return.
“Production naturally drops when going from contract to wages, with workers who had been picking six bins down to four or five per day,” he said. “So, it cost me extra per bin, but my packout increased, and I made an extra $50 a bin, so I was actually better off. Sometimes quick is not always better.”
Steps growers could take to improve quality and returns included good crop load management, pruning and thinning to ensure bud counts were in line with the target size they were aiming to achieve, and netting.
Since losing around 100 acres to hail a week before harvest 10 years ago, the Barollis have steadily netted a little bit every year, to the point 85 per cent of the orchards is now covered, delivering benefits in less hail, sun and bird damage as well as cleaner fruit and better water retention.
“It’s lifted packouts by 5 to 20 per cent,” he said. “We now include netting in the budget when considering new blocks. Having the data available has made the decision easier to make. The margins are too thin, with risk involved.”
This article was first published in the Winter 2025 edition of AFG.