Introducing the orchard KPI scorecards
Is it time your orchard had a health and performance assessment? New Future Orchards KPI scorecards for your business and blocks will help to focus your attention on critical performance factors.
In recent times, the Australian pome fruit industry has been subjected to back-to-back years of profitability challenges, meaning informed decision-making is critical for orchardists now more than ever. Decisions from the business level right down to the block level need good data backing, but the range of metrics that could be collected on-orchard is vast.
In the 2025 winter series of Future Orchards® walks, AgFirst’s Jonathan Brookes and Ross Wilson introduced examples of key performance indicators (KPIs), summarised into two simple scorecards. These scorecards have been designed to assist growers with reviewing orchard outcomes across a business level and down to a block level.
KPIs are a common business world concept, used to track performance over time. When utilised in the orchard, they prompt growers to consider orchard performance attributes and provide a direction for orchard metric collection, allowing growers to quantify and rank collected data against the specific KPIs.
The scorecards then provide a simple framework to summarise the KPI achievement or progress through a scoring system on a 1–5 scale, where 1 is an extremely poor result, 3 is an average result and 5 is an extremely good result. Where a KPI has been given a score of less than 4, a management action for improvement should be recorded.
An orchard is a busy place, so this process is a thought-prompting exercise, to focus a grower’s attention on critical performance factors and keep these at the forefront of decision-making, using quantifiable outcomes backed by data. This then gives the grower confidence by highlighting areas of prioritisation for the season ahead, to make sure the day-to-day tasks align with the KPI outcomes. A completed scorecard will help a grower objectively consider how a block is performing, and what actions are necessary to improve that performance further.
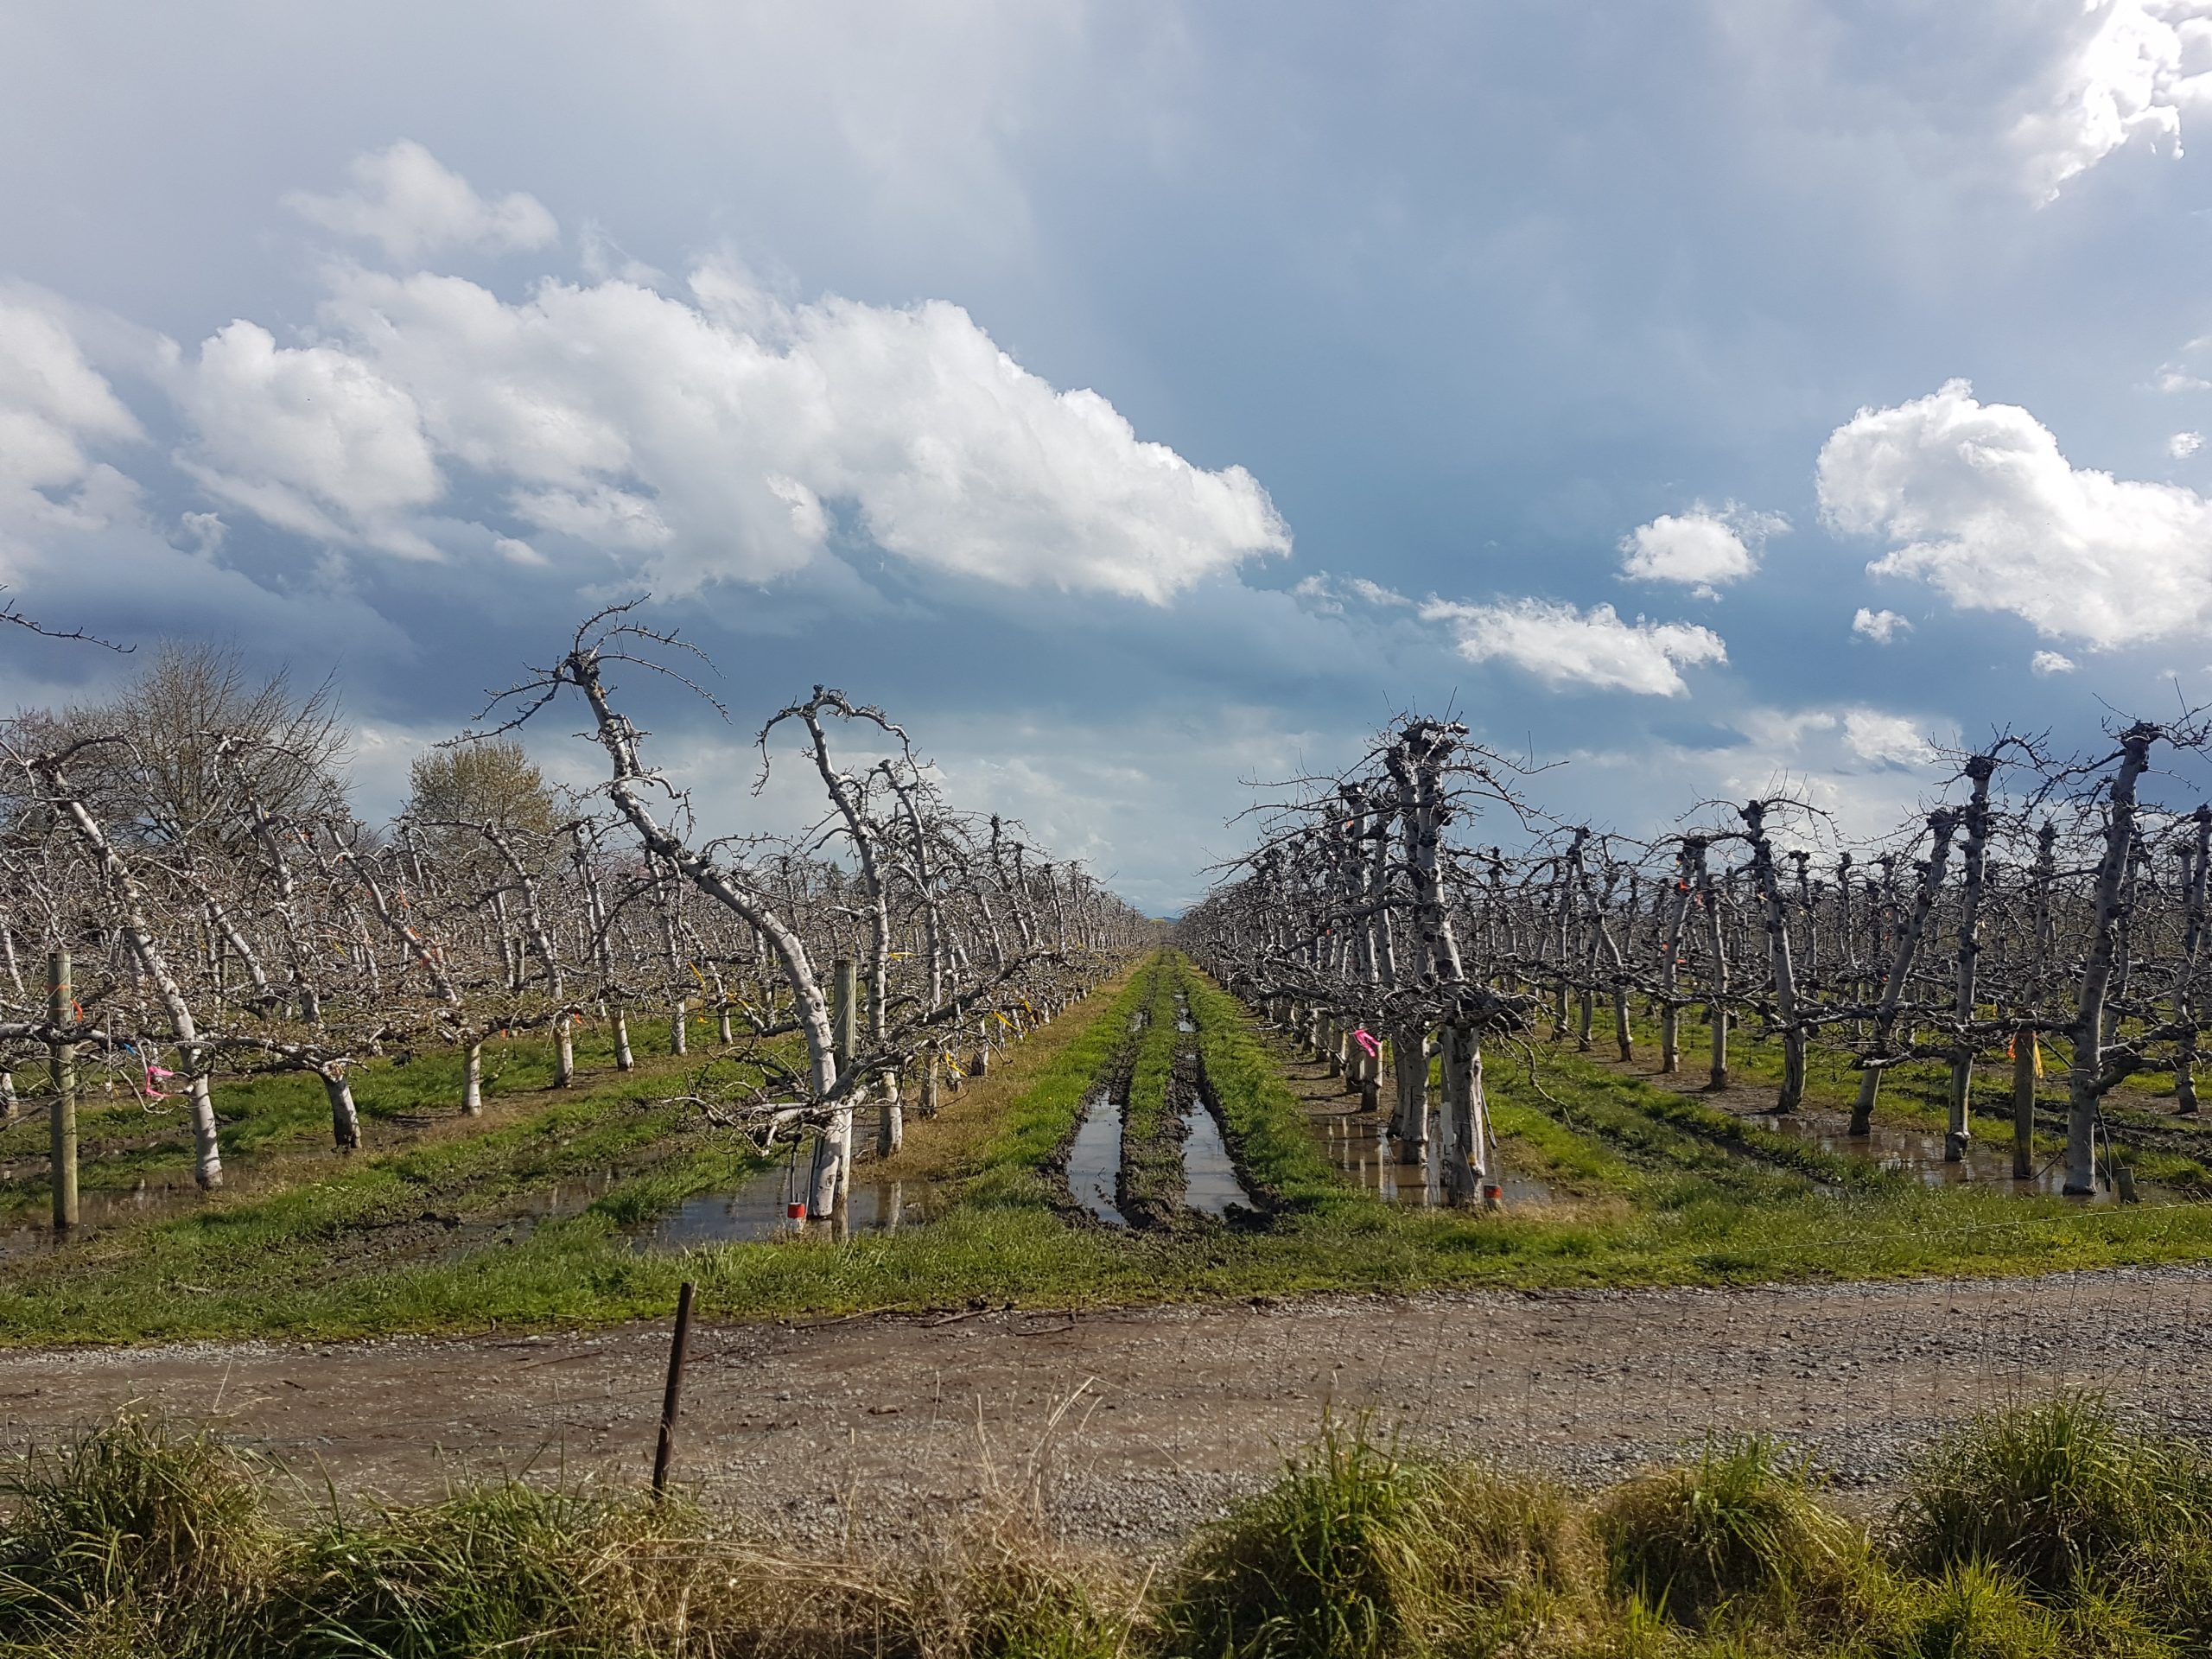
This block scored a 1 in canopy structure due to the lack of adequate posts, resulting in leaning trees and susceptibility to canopy failure if met with cyclonic conditions close to harvest. The block’s subsurface drainage system needs repairing (scoring a 2) and, although the canopy is fairly consistent (scoring a 4), the crop has a strong biennial swing (scoring a 2). The grower needs to carefully consider the future of this block, as the variety is barely profitable (scoring a 3) with a poor ability for the profit to improve (scoring a 1).
Orchard business KPI scorecard
The KPIs outlined on the orchard business scorecard cover a range of attributes at the business level, including risk factors, consideration of labour capability, capital ability, debt management and profitability. Some of these metrics are not directly related to production, but each can have a significant impact on orchard outcomes and could be a limiting factor which may require capital input to address.
Understanding how the orchard business performs on the KPI scorecard, and where the limitations may be, prior to making block decisions is vital. Taking stock of the business limitations will assist with wider context for the orchard direction, help with prioritisation and provide an understanding of the reality of implementing any specific block improvement strategies.
Table 1 outlines the KPIs from the orchard business scorecard, alongside some prompts to consider when ranking the performance outcome.
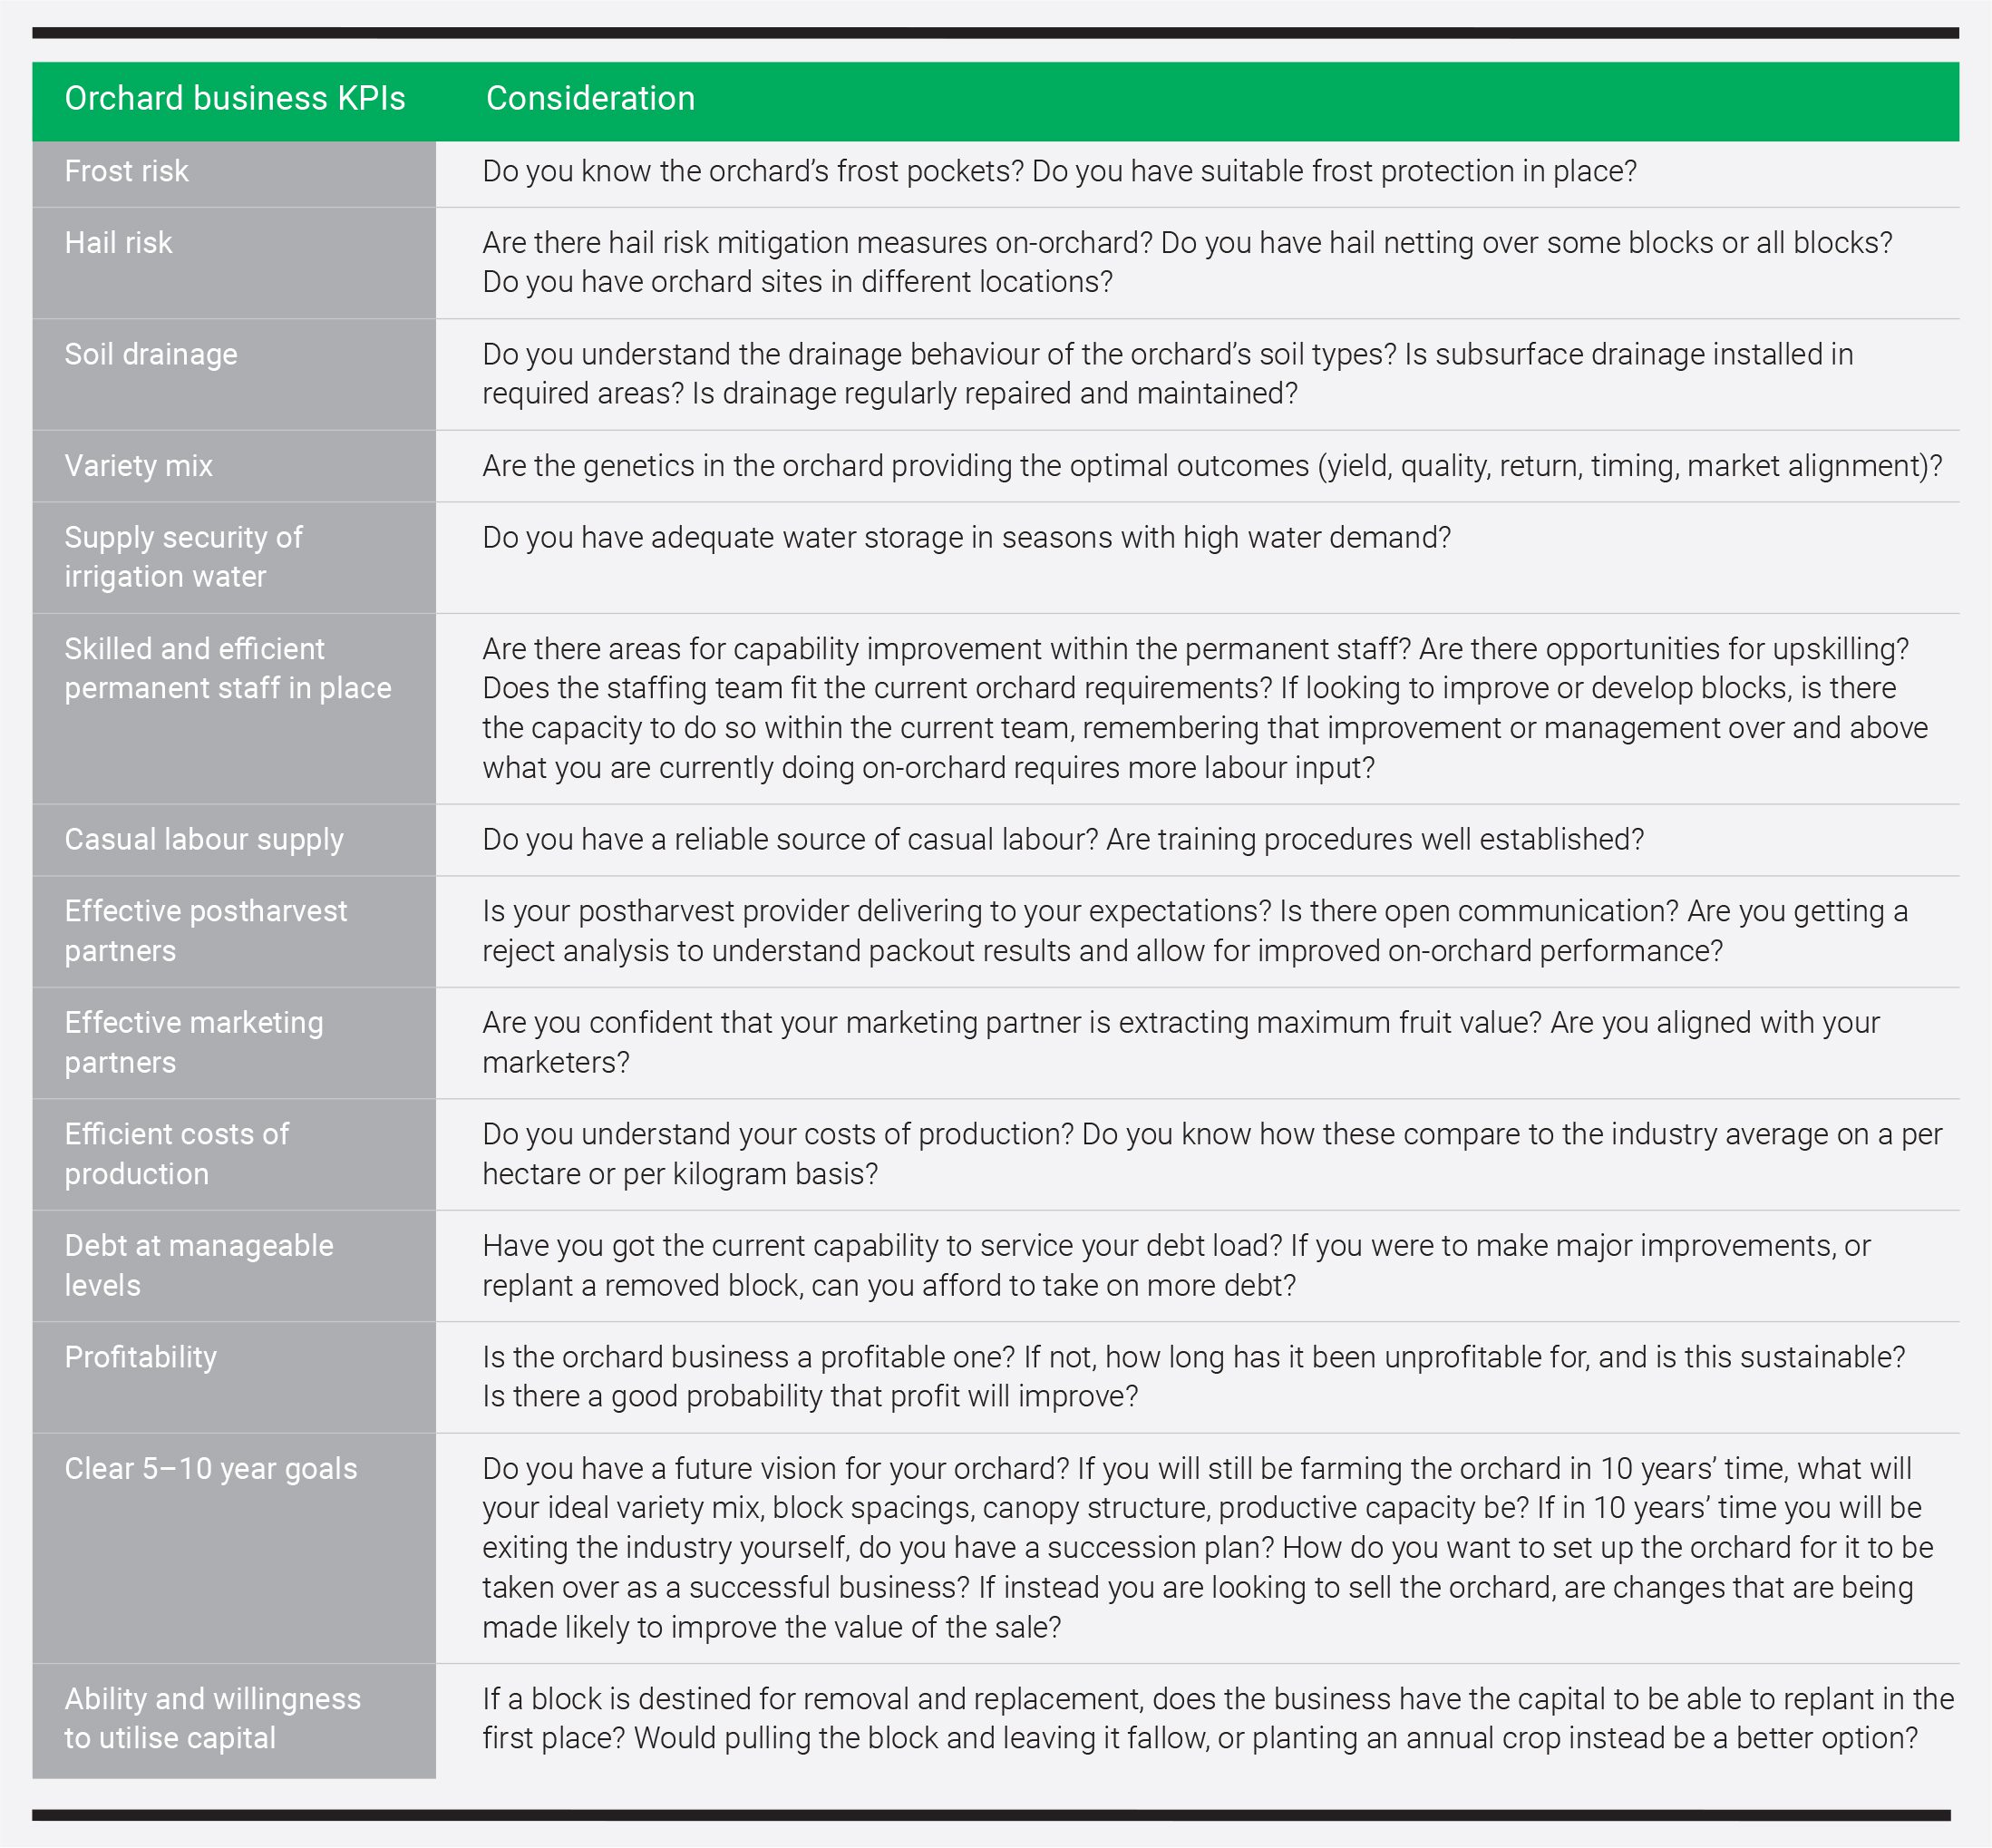
Table 1: Orchard business KPIs and thought prompts.
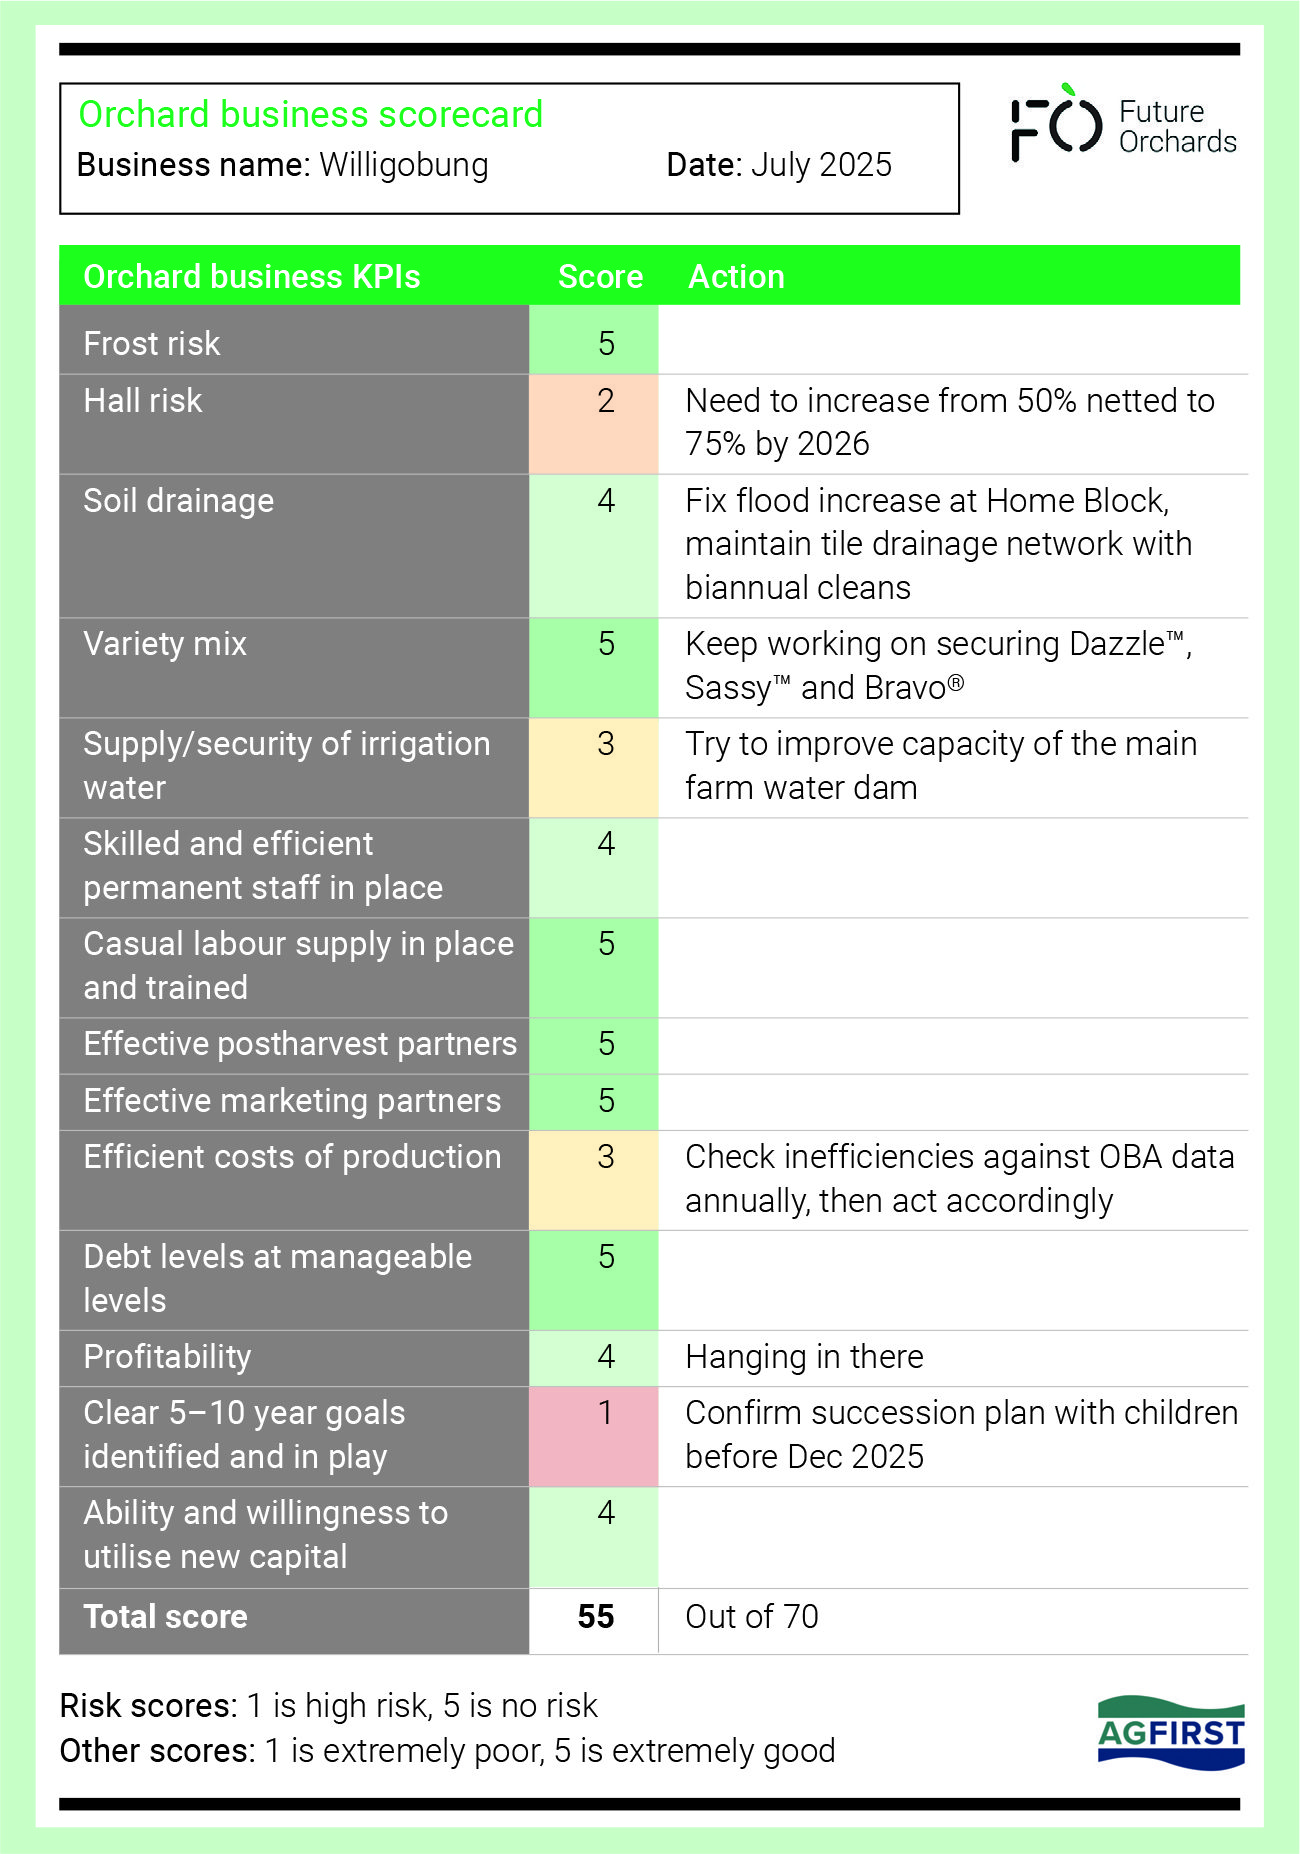
Figure 1: Orchard business scorecard case study.
Figure 1 is a case study orchard showing how the orchard business scorecard works. A score of 1 is shaded red, 2 is orange, 3 is yellow, 4 is light green and 5 a darker shade of green, allowing your eye to be drawn to the red shading and therefore areas of most urgency/attention. In the business in Figure 1, four key limiting factors have been identified: hail risk, irrigation water supply, high costs of production, and no documented succession plan. Each of these limitations needs to be addressed to protect the future of the business.
Once you have completed your own orchard business scorecard, you should have a clear understanding of these business-level questions and brainstormed actions to implement. Now it’s time to head out to the orchard with a notebook and your block scorecard template to make some block-level decisions.
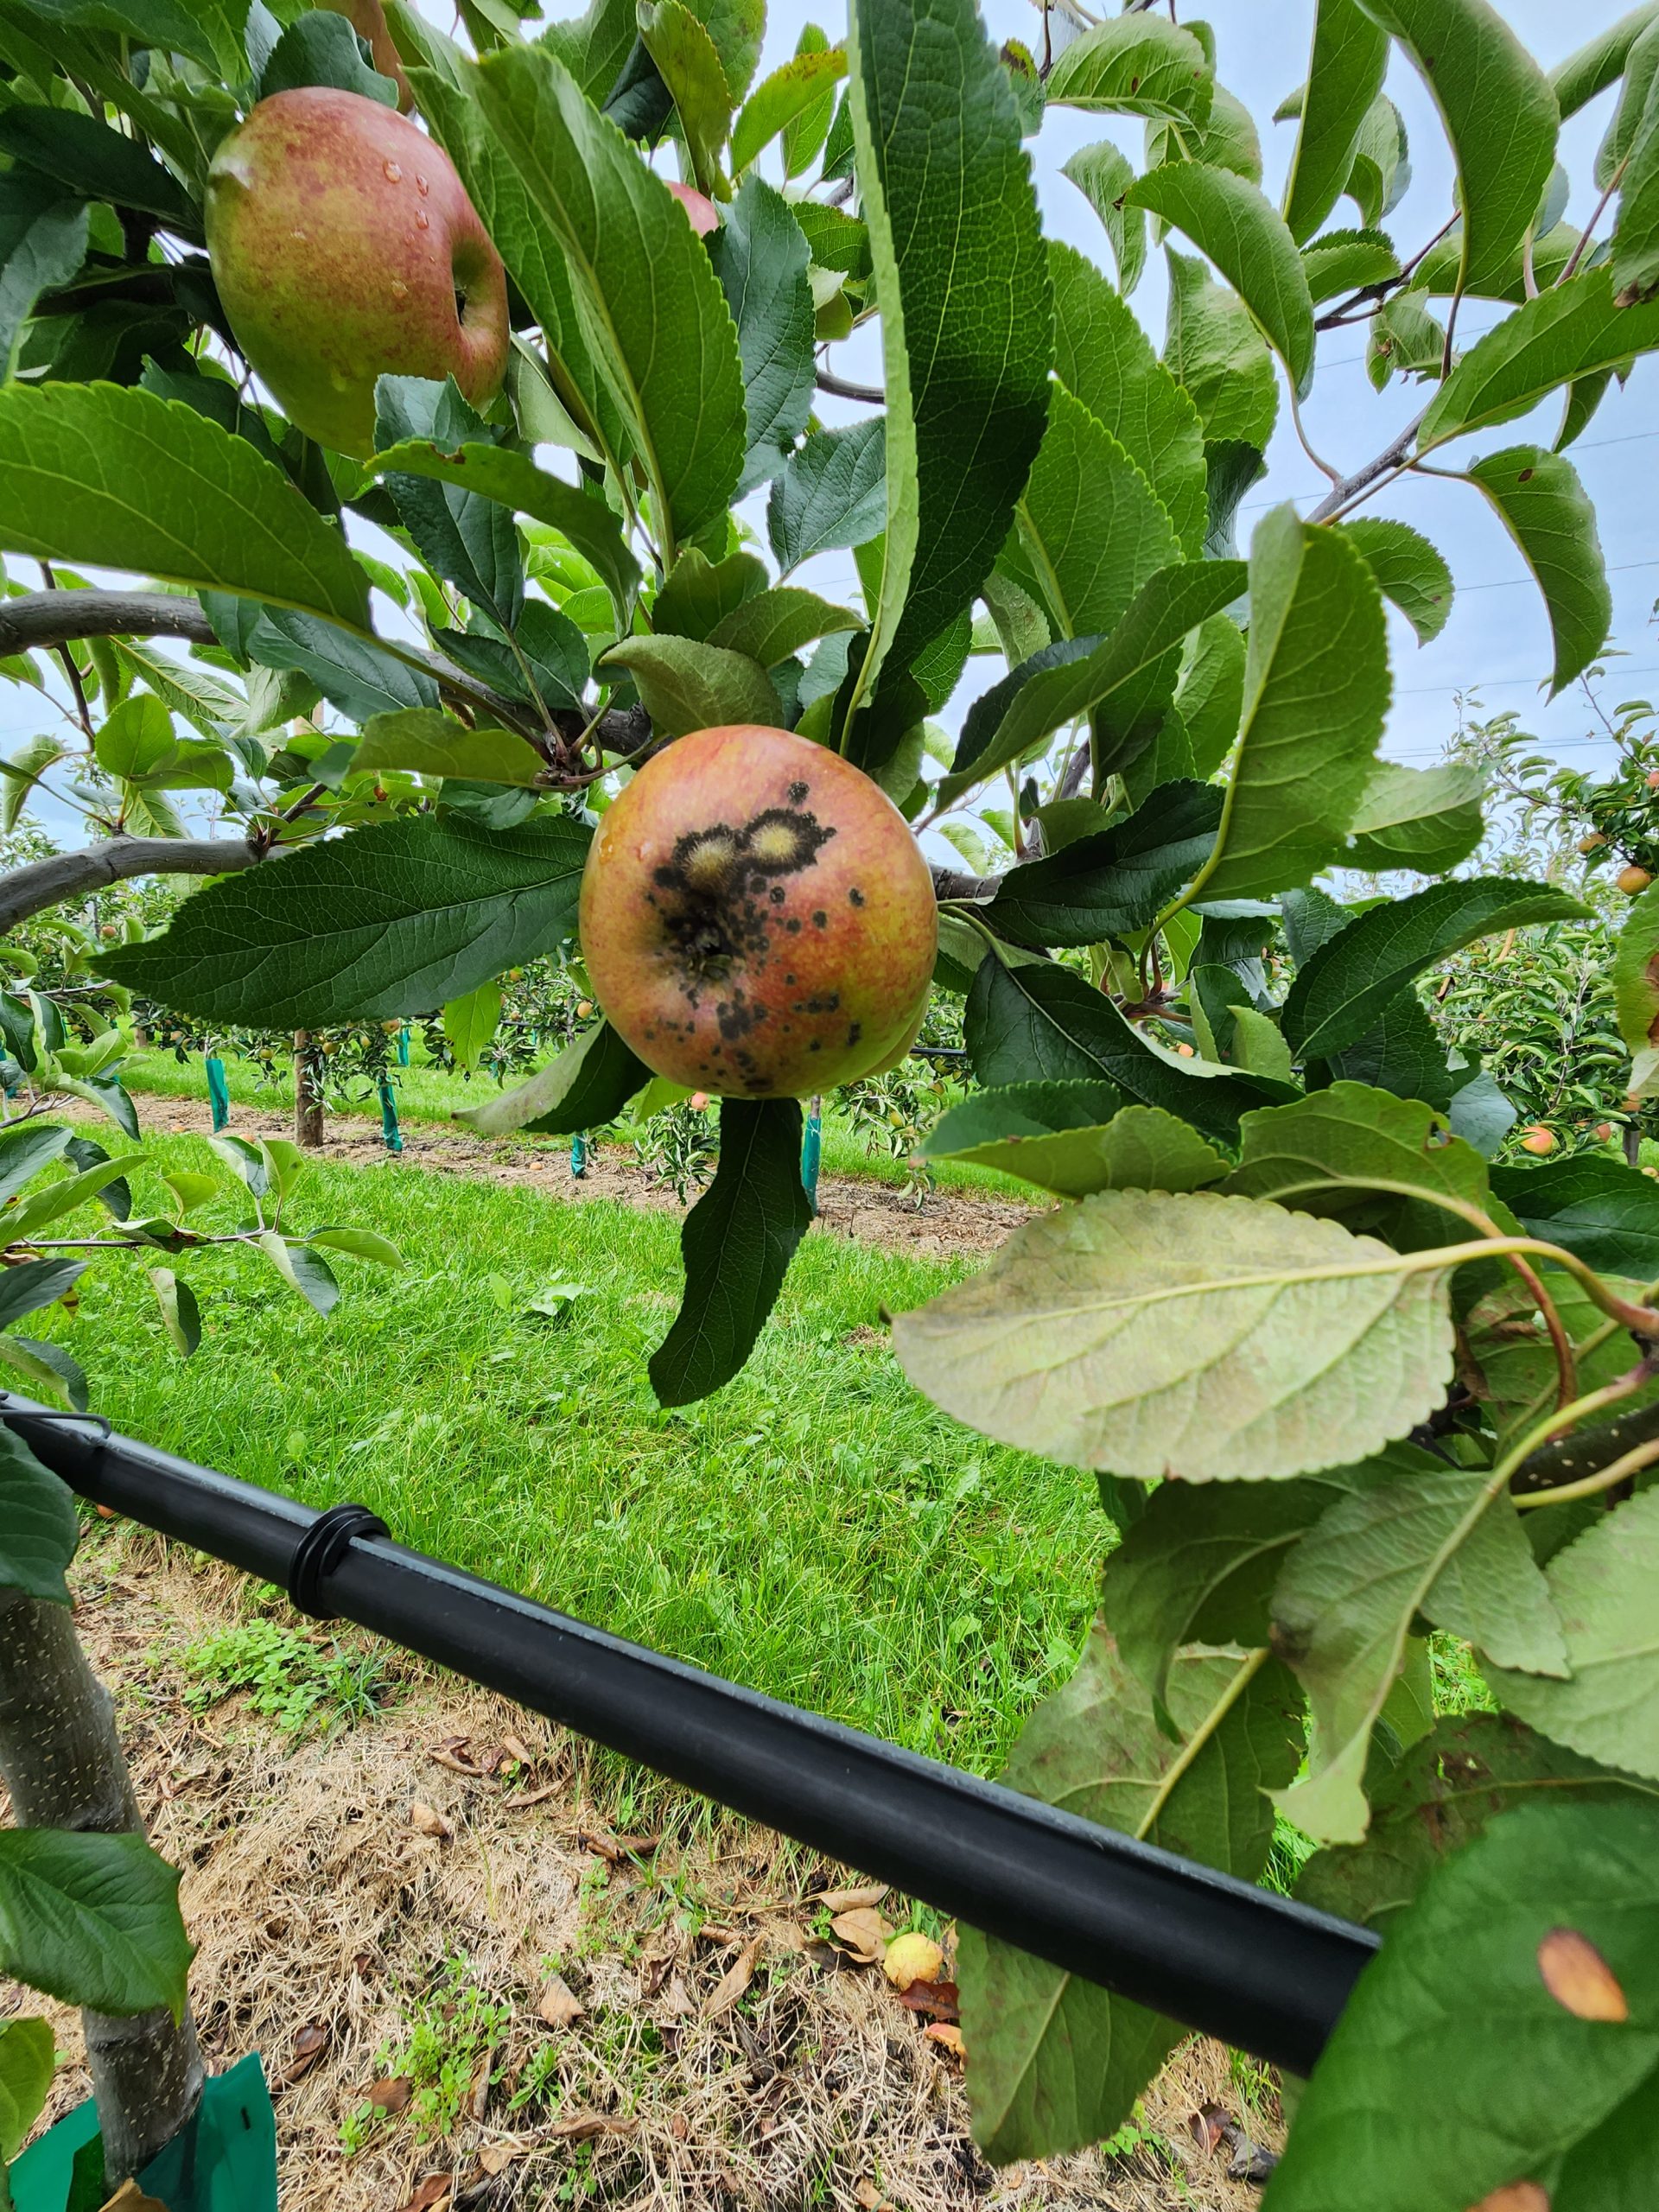
This block experienced black spot incidence due to poor spray coverage. There was a 4–5 per cent incidence across the block, therefore scoring a 2, with an action to check sprayer calibration and setup.
Block-specific KPI scorecard
The block improvement scorecard summarises the block’s limiting factors, canopy development, production performance and profitability outcomes. It allows growers to understand whether the block is achieving yields, packouts and prices that provide the income required to cover the cost of farming that block and, therefore, how that individual block contributes to the bottom line of the orchard.
Be sure to have to hand the latest copy of the Australian Pome Fruit Industry Orchard Business Analysis Report1 to quantify various metrics against industry average data, to help with objective performance scoring against industry averages for the varieties. During the 2025 winter orchard walks presentation, AgFirst also presented the key industry benchmarks that are useful when attributing a score to your own blocks (see Further information).
The orchard’s star blocks – the ones which are top performers – are not the first blocks you’re targeting with this scorecard. However, all other blocks should be interrogated and a scorecard completed. Sometimes just as much progress can be made by making incremental improvements in the good blocks, as well as major decisions on the poor blocks.
Table 2 outlines the KPIs from the block-specific scorecard, alongside some prompts to consider when ranking the performance outcome.
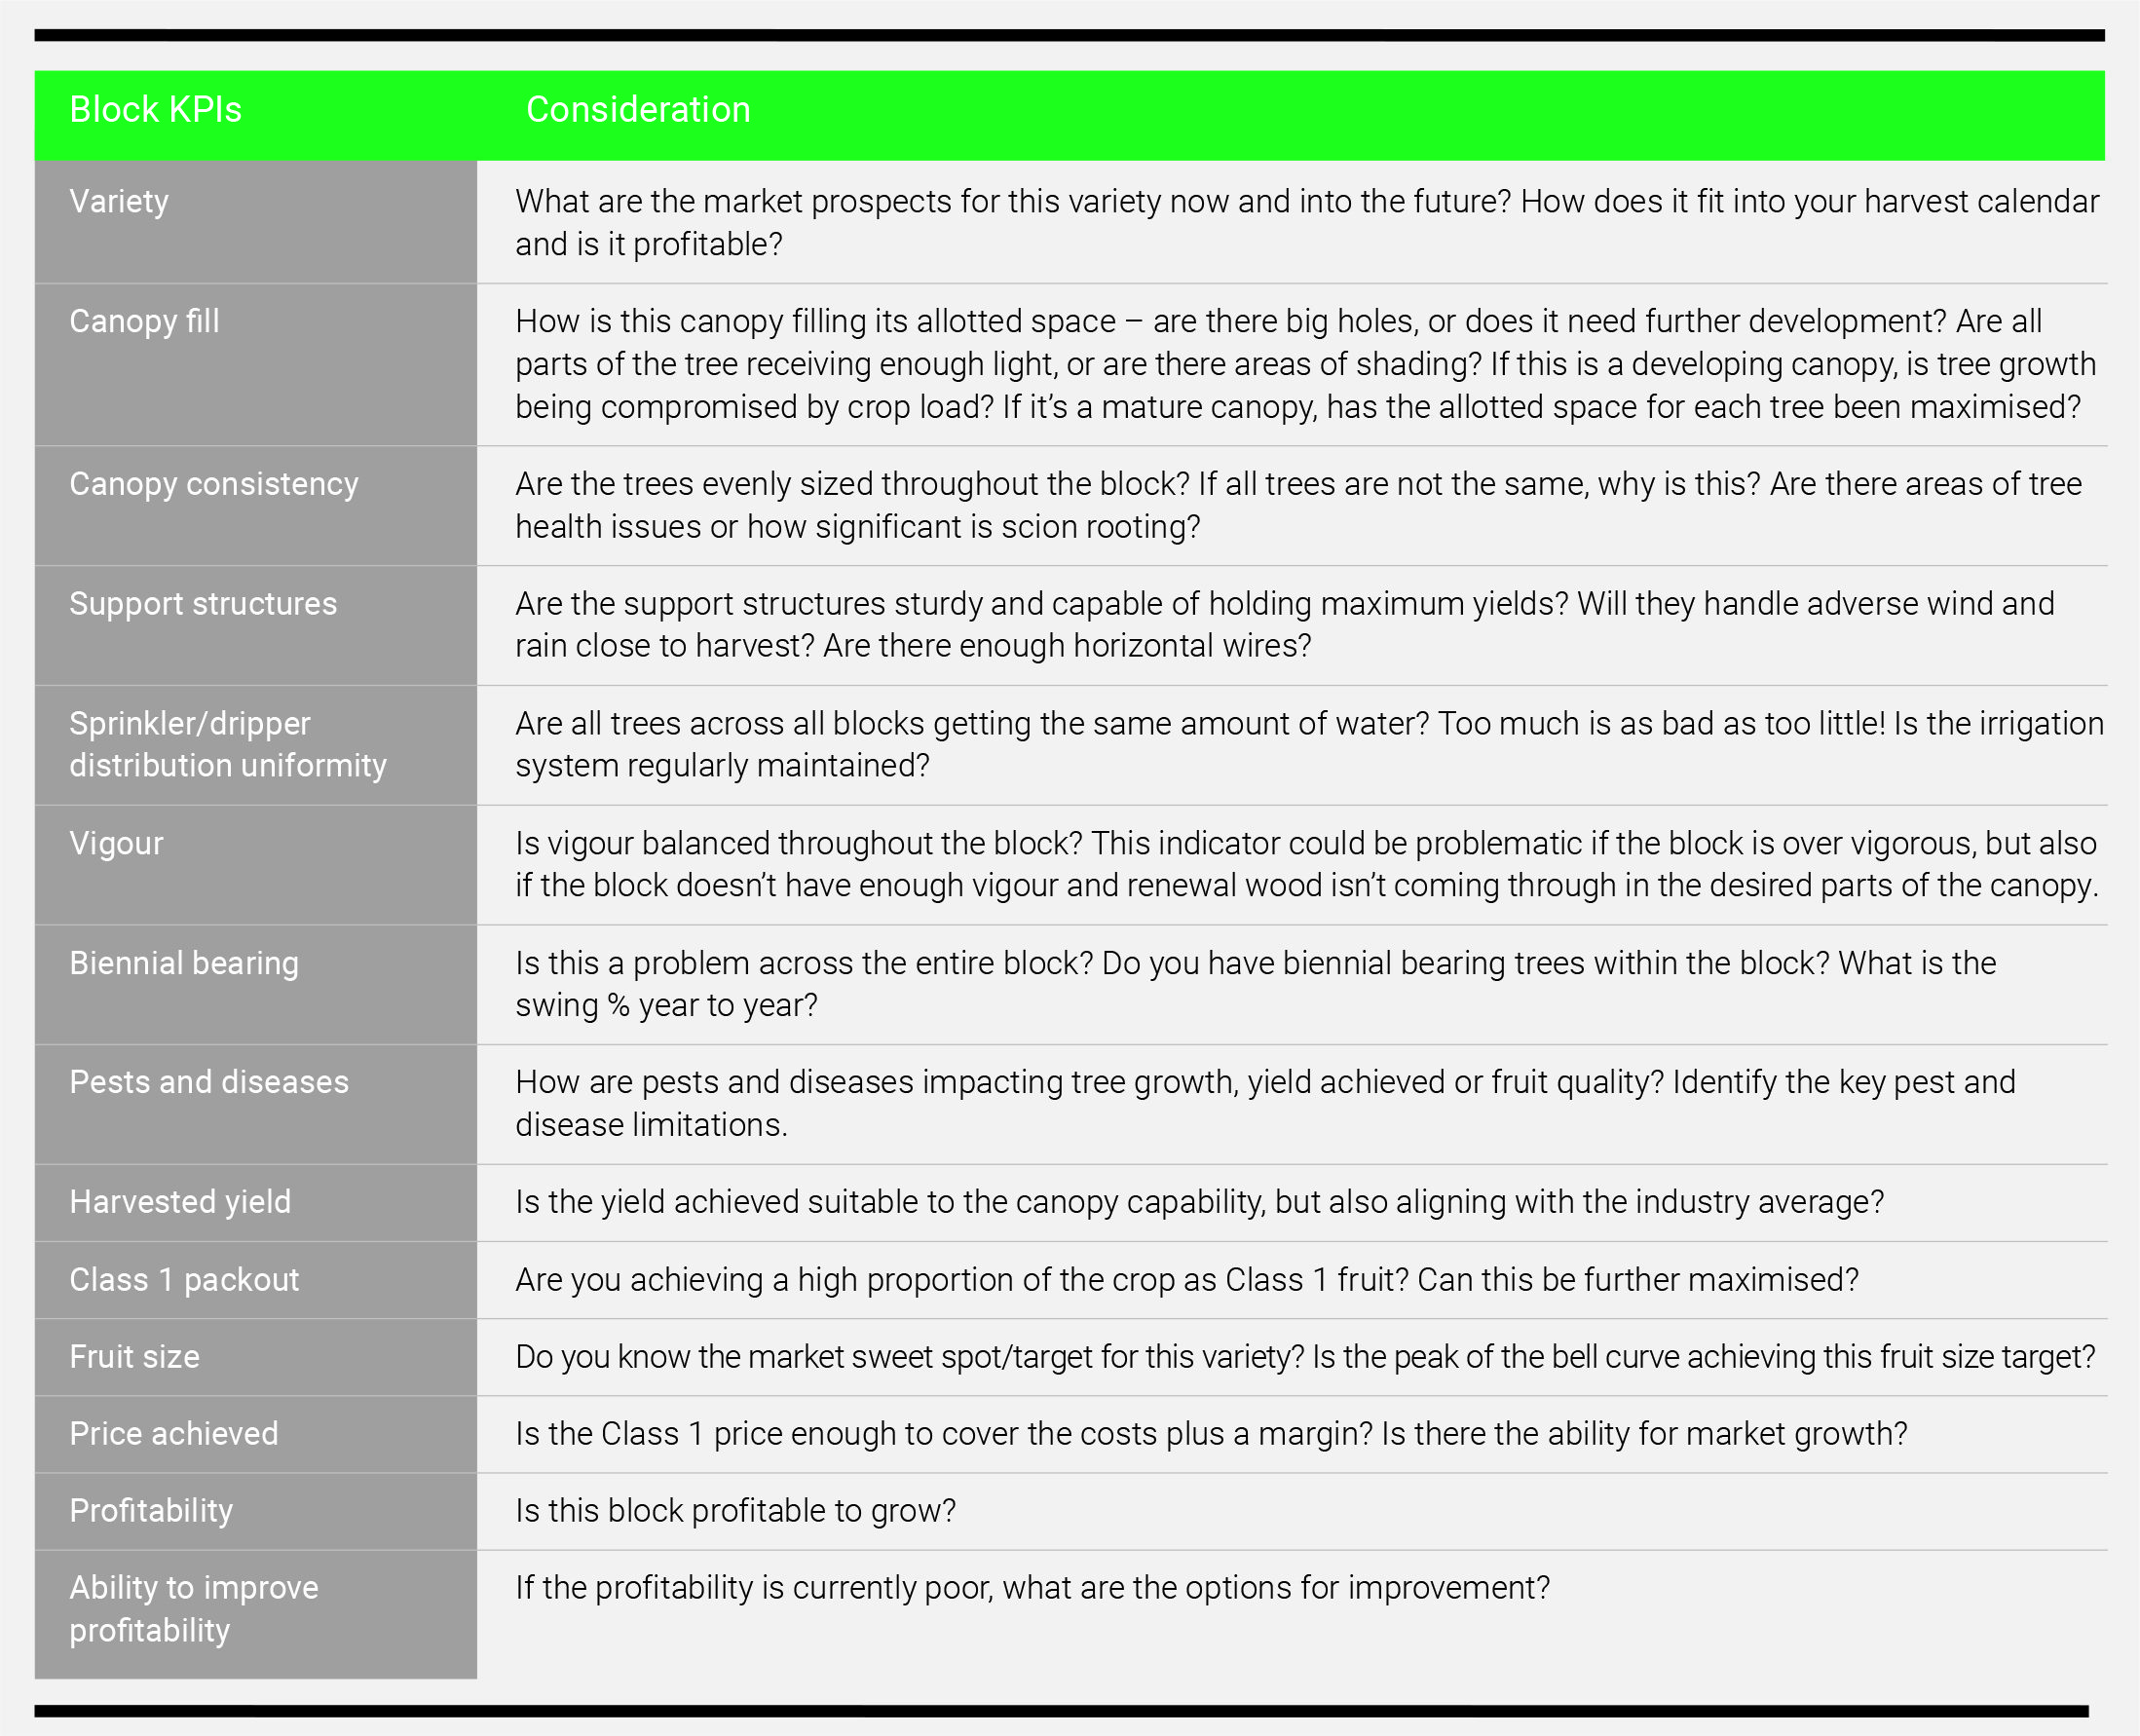
Table 2: Block-specific KPIs and thought prompts.
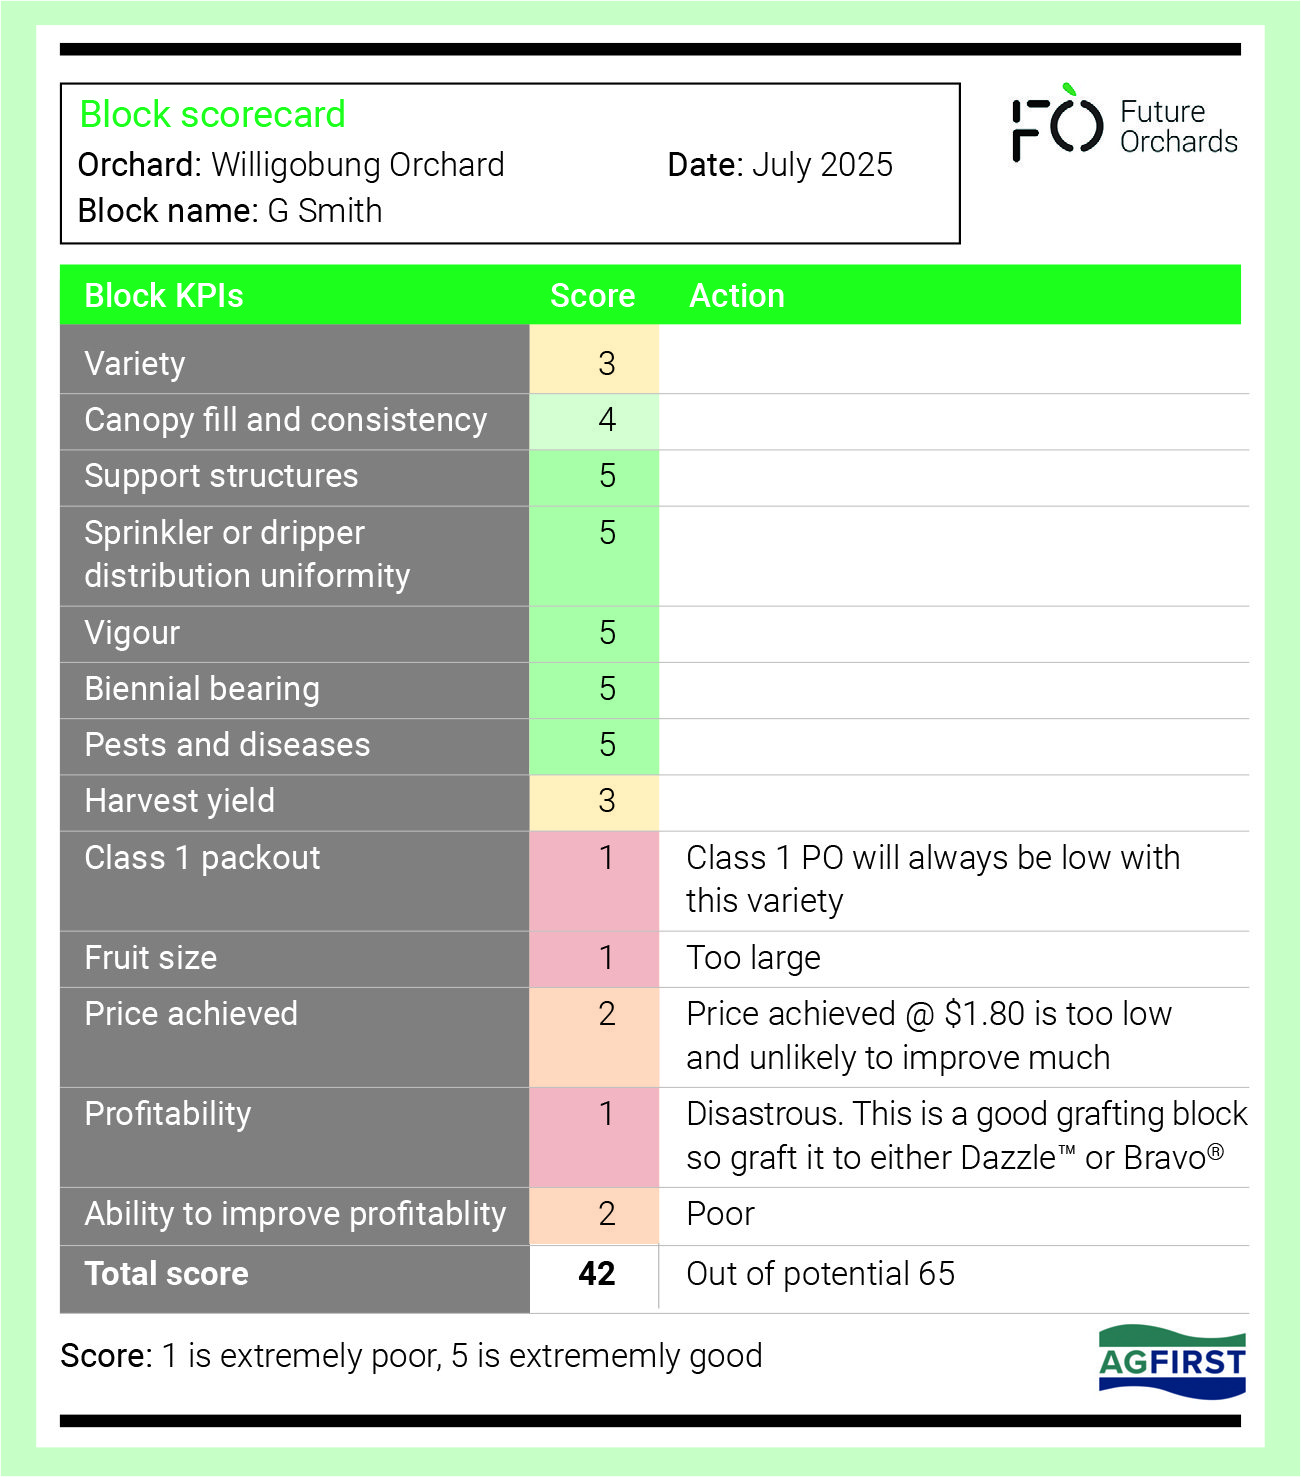
Figure 2: Block scorecard.
Figure 2 is a case study of a young, unnetted block of Granny Smith. This grower has decided that planting Granny Smith was a bad idea and the likelihood of the block making good profits into the future are poor. The block has good infrastructure and is an ideal candidate to be grafted to a variety more likely to achieve good margins over and above cost of production.
Putting that information to work
The score against the KPI alone is worthless without the follow-up decision-making and on-orchard actions. Once the orchard and blocks have been scored, the next step is to understand the ability to fix that parameter and the management actions required to do so. Additionally, if there were any KPIs you couldn’t give a score to due to not having the information at hand, the first action should be to implement a data collection process to quantify performance in this area.
Further insights can be revealed when comparing the different block scorecards across the orchard. Which blocks are performing better and why might that be? Or conversely, which blocks may not be performing well? The scorecard KPIs can help to objectively understand why this might be the case, as well as potentially provide direction for any management actions which should be replicated. This would also be a good time to categorise your blocks into the Improve or Remove matrix (the concept introduced during the 2024 Future Orchards walks) with the scorecard providing a quick reference of KPI performance.
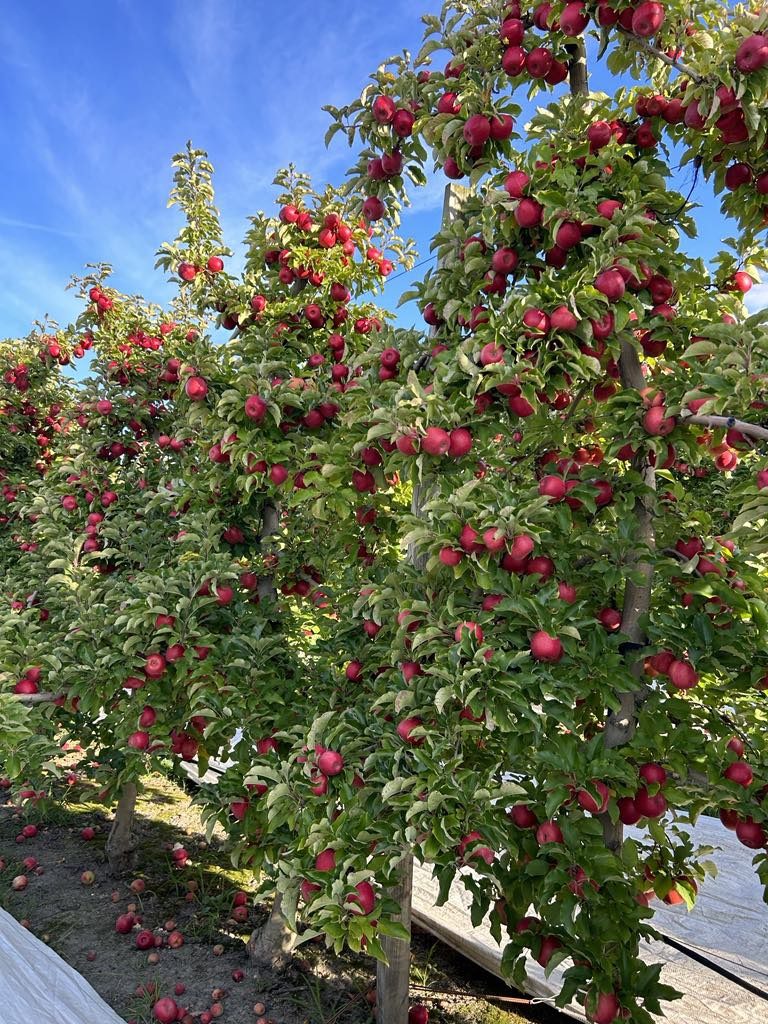
This is a high-colour Cripps Pink block, scoring a 4 for variety and 5 for harvested yield and Class 1 packout. The grower’s action here is to now run the numbers to check the profitability of this block as well as try to replicate this good crop outcome in the next growing season.
At the end of this exercise, you will be left with a summary of the health and performance of the orchard business as well as a score given to each block. You will also have a list of those management actions to prioritise and use to create a plan for execution. Be sure to then monitor progress throughout the season. Then, complete the scorecard for the block at the same time the following year to review how those actions have improved the scores or determine if, despite those efforts, the block still is underperforming and it is time for removal.
By implementing the scorecard tools, growers can have confidence to make continuous improvements during a difficult growing environment.
Further information
Head to the Winter Orchard Walks and Orchard Talks – July 2025 section of the Future Orchards Library to view Jonathan Brookes and Ross Wilson’s presentation slides introducing the scorecard and to download blank business and block scorecard templates: https://apal.org.au/programs/future-orchards/future-orchards-library/
Find out more about the Improve or Remove matrix in the “Maximising profitability by meeting market demands” presentation slides in the Spring Orchard Walks and Orchard Talks – July 2024 section of the Future Orchards Library.
Future Orchards® is part of the Developing orchardists of the future (LP23001) pilot program, which is funded through Hort Innovation Frontiers with co-investment from APAL and Pink Lady® and contributions from the Australian Government.
This article was first published in the spring 2025 edition of AFG.